We use Mixpanel as our Analytics tool, which has RevenueCat events fired for trial start and trial convert. However, our number of trial starts and trial converts, as well as the revenue in the latter event do not add up to match the numbers in the RevenueCat dashboard.
I’ve used the data discrepancy article from RevenueCat, which doesn’t include the answer:
Any ideas why these are different? This is crucial for our OKRs and revenue tracking
Best answer by ryan
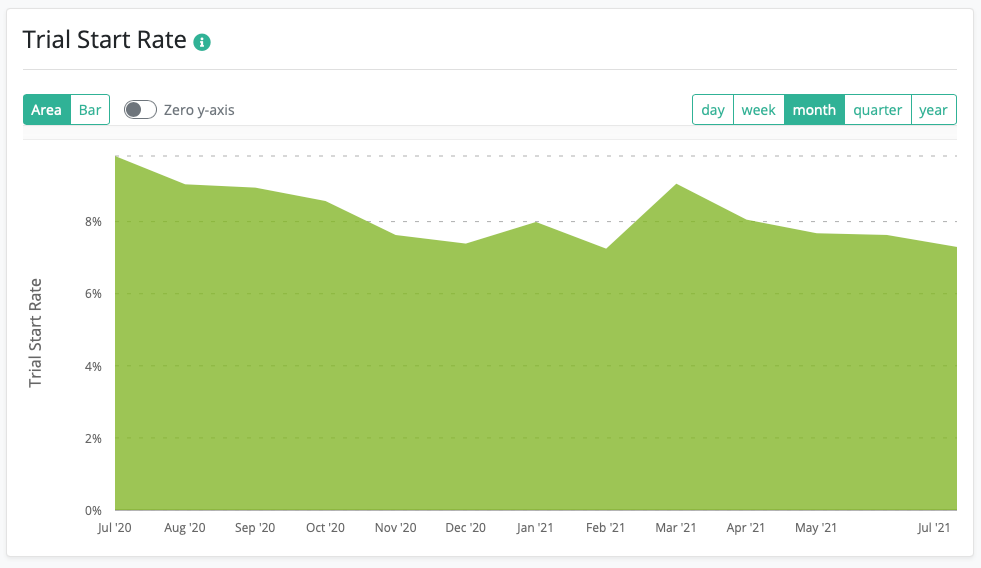
Two things I’ve seen before with the old Trial Start Rate chart and Trial Conversion chart that has caused confusion around data discrepancies are not taking the conversion windows into account when looking at other systems.
The old Trial Start Rate chart (below) is the percentage of trials started within 7 days of the customer being first seen in RevenueCat.
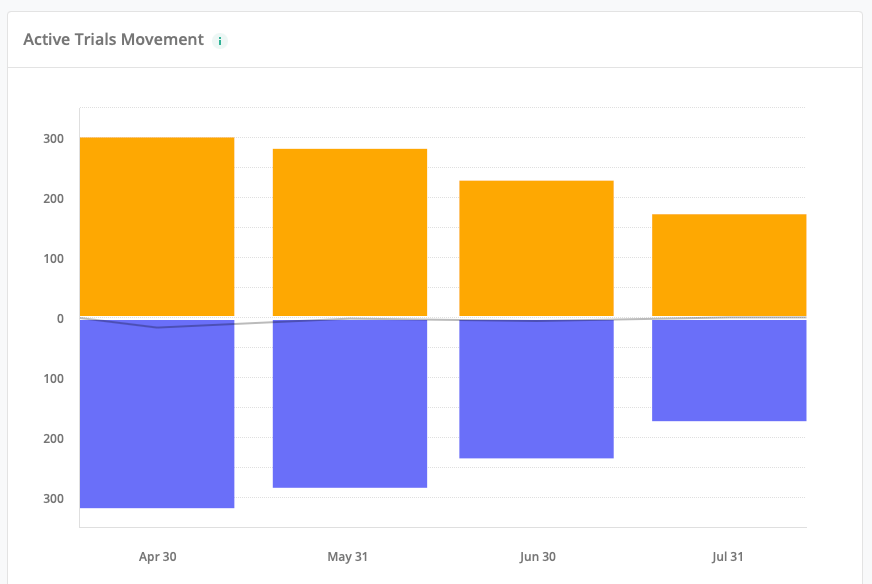
A better chart to compare against the number of new trials started in Mixpanel would be to look at the New Trials number in the Active Trials Movement chart (below).
Similarly, the old Trial Conversion chart in RevenueCat uses a 24hr conversion window. Meaning that a trial conversion is only shown in the chart if it goes from free to paid within 24hrs of the expiration date. In Mixpanel, a trial conversion event is dispatched even if it’s been days/weeks/month since the free trial expired.
A better chart to look at here would be the new Trial Conversion Funnel, or the New Actives number in the Active Subscriptions Movement chart (assuming all subscriptions start with a free trial).
Other things that usually cause smaller discrepancies are the differences in Mixpanel being an event-based analytics system and RevenueCat charts being snapshot based. Meaning things like refunds would remove an active subscription from the chart in RevenueCat, but events never get removed from Mixpanel.
Two things I’ve seen before with the old Trial Start Rate chart and Trial Conversion chart that has caused confusion around data discrepancies are not taking the conversion windows into account when looking at other systems.
The old Trial Start Rate chart (below) is the percentage of trials started within 7 days of the customer being first seen in RevenueCat.
A better chart to compare against the number of new trials started in Mixpanel would be to look at the New Trials number in the Active Trials Movement chart (below).
Similarly, the old Trial Conversion chart in RevenueCat uses a 24hr conversion window. Meaning that a trial conversion is only shown in the chart if it goes from free to paid within 24hrs of the expiration date. In Mixpanel, a trial conversion event is dispatched even if it’s been days/weeks/month since the free trial expired.
A better chart to look at here would be the new Trial Conversion Funnel, or the New Actives number in the Active Subscriptions Movement chart (assuming all subscriptions start with a free trial).
Other things that usually cause smaller discrepancies are the differences in Mixpanel being an event-based analytics system and RevenueCat charts being snapshot based. Meaning things like refunds would remove an active subscription from the chart in RevenueCat, but events never get removed from Mixpanel.