

Many of our charts can be segmented by a variety of dimensions to make it easy to compare performance between different criteria, and unlock critical insights about where the greatest strengths and opportunities in your business lie. Today we’re excited to release support for segmentation for Subscriber Retention so you can quickly understand how key dimensions of your business affect your customer retention. Here’s how it works:

By default, Subscriber Retention will continue to be cohorted by subscription start month. This chart is currently cohorted by subscription start month to make it easy to see how your retention is trending for recent subscriber cohorts. Think of this cohorting as its own kind of segmentation: we’re taking one larger cohort of users (defined by the Date Range being viewed), and segmenting them by their subscription start month to compare retention rates.
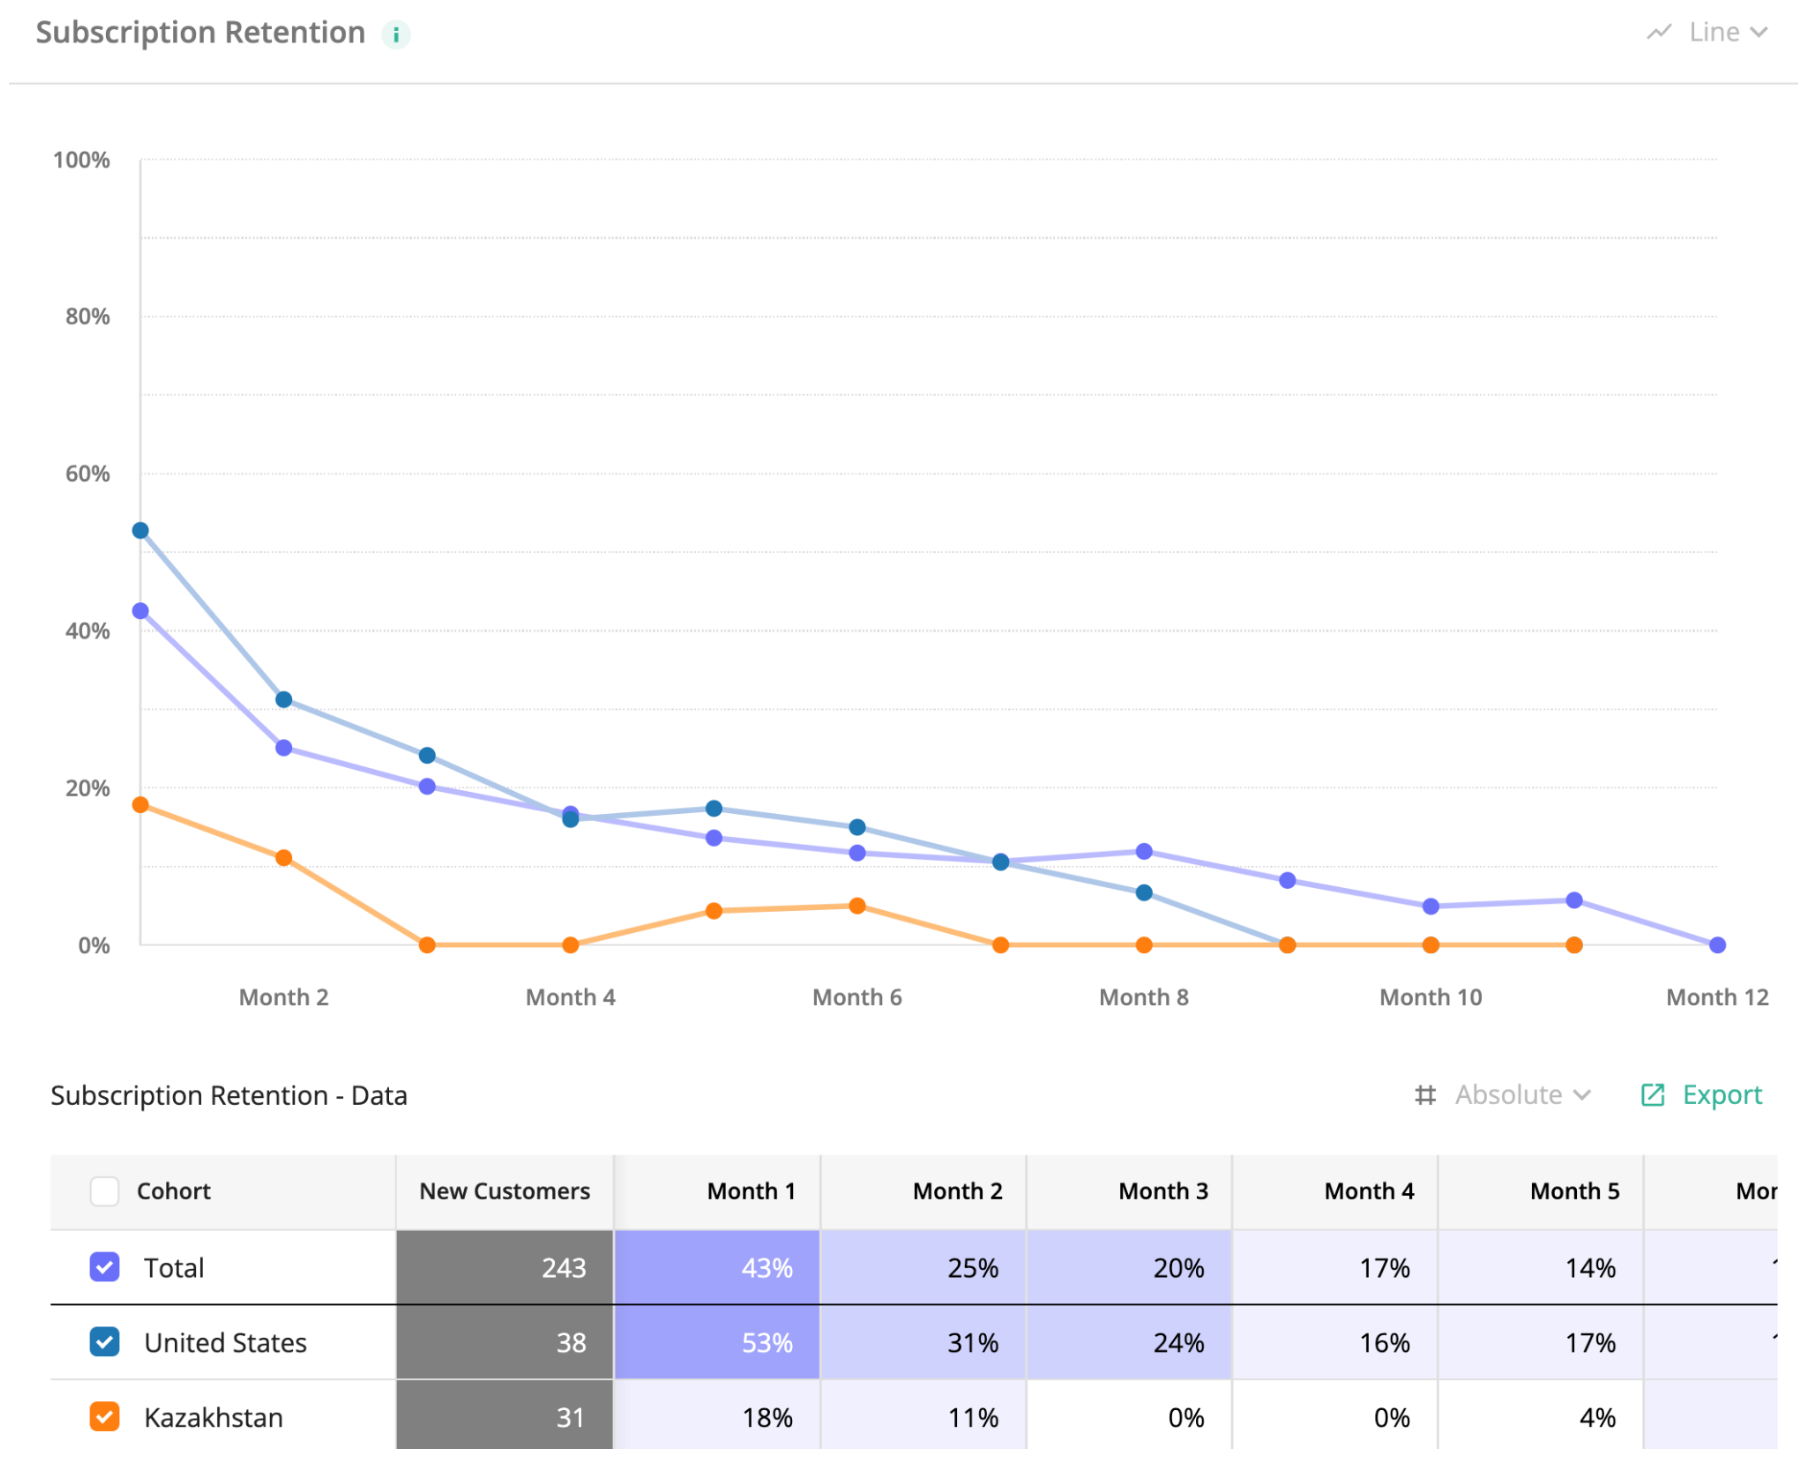
Now, with the option to change the chart’s segmentation, when you choose a different dimension to segment by (such as your top 5 countries, or by your Projects), we'll show you a single retention rate for each segment that represents the full cohort you’ve selected (defined by the Date Range being viewed).
This creates a data dilemma, though: if you’re viewing the last 12 month of new subscribers, some of those subscribers will only be a few months old, and have not had the opportunity to retain for the whole timeframe. We’ve addressed this by introducing the concept of cohort maturity into our data model to ensure that at each level of granularity (date, month, year, etc.) we only calculate the retention for the cohorts that have had the opportunity to convert, and are therefore considered “mature.”
We specifically use this approach when segmenting by any dimension other than a subscription start time, to normalize each subscribers opportunity to retain even if they started at different points in time. (The default behavior of this chart when segmenting by Subscription start month is unchanged)
We hope you find creative ways to use this data to learn more about your business and your specific opportunities to optimize and grow. If you have any feedback or questions, we’d love to hear from you!
Thanks,
Dan
