Over the past few months, we’ve been busy at work improving our new charts. Starting today, we have migrated everyone to the new charts experience. The new charts do not just have a refreshed look & feel, they also provide improved functionality over the old charts:
-
We have launched a number of new charts:
-
Annual Recurring Revenue (ARR) provides an industry-standard way of looking at your recurring revenue, normalized by subscription duration.
-
Movement charts (Active Subscriptions Movement, MRR Movement, Active Trials Movement) provide full transparency on what causes important indicators of your business to increase or decrease.
-
Refund Rate offers a view of what proportion of your transactions end up getting refunded.
-
Initial Conversion allows analyzing what proportion of newly acquired customers take an action on your paywall (starting a free trial, starting a paid subscription, or making a one-time purchase).
-
Conversion to Paid allows analyzing what proportion of newly acquired customers end up paying.
-
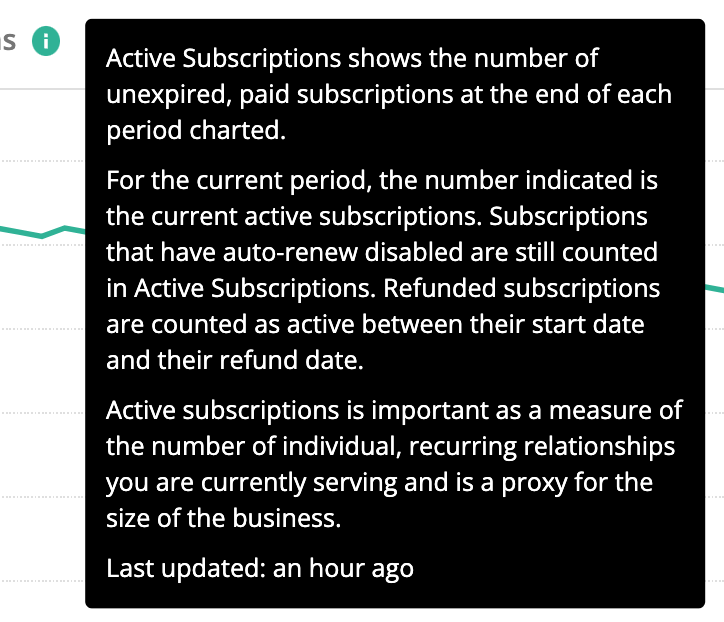
- Data in the new charts gets refreshed much more frequently. Data in the new charts is typically less than an hour old; the old charts refreshed only on a daily basis. You can find out when the data was last refreshed by hovering over the (i) icon on any chart.
We will keep iterating on these new charts and adding new charts and new ways to slice and dice the data. Not all old charts were migrated 1:1 to the new charts, we tried to consciously improve the data presentation in the new charts.
If you have questions, requests for additional information to show, or any other comments, please let us know in the comments below!