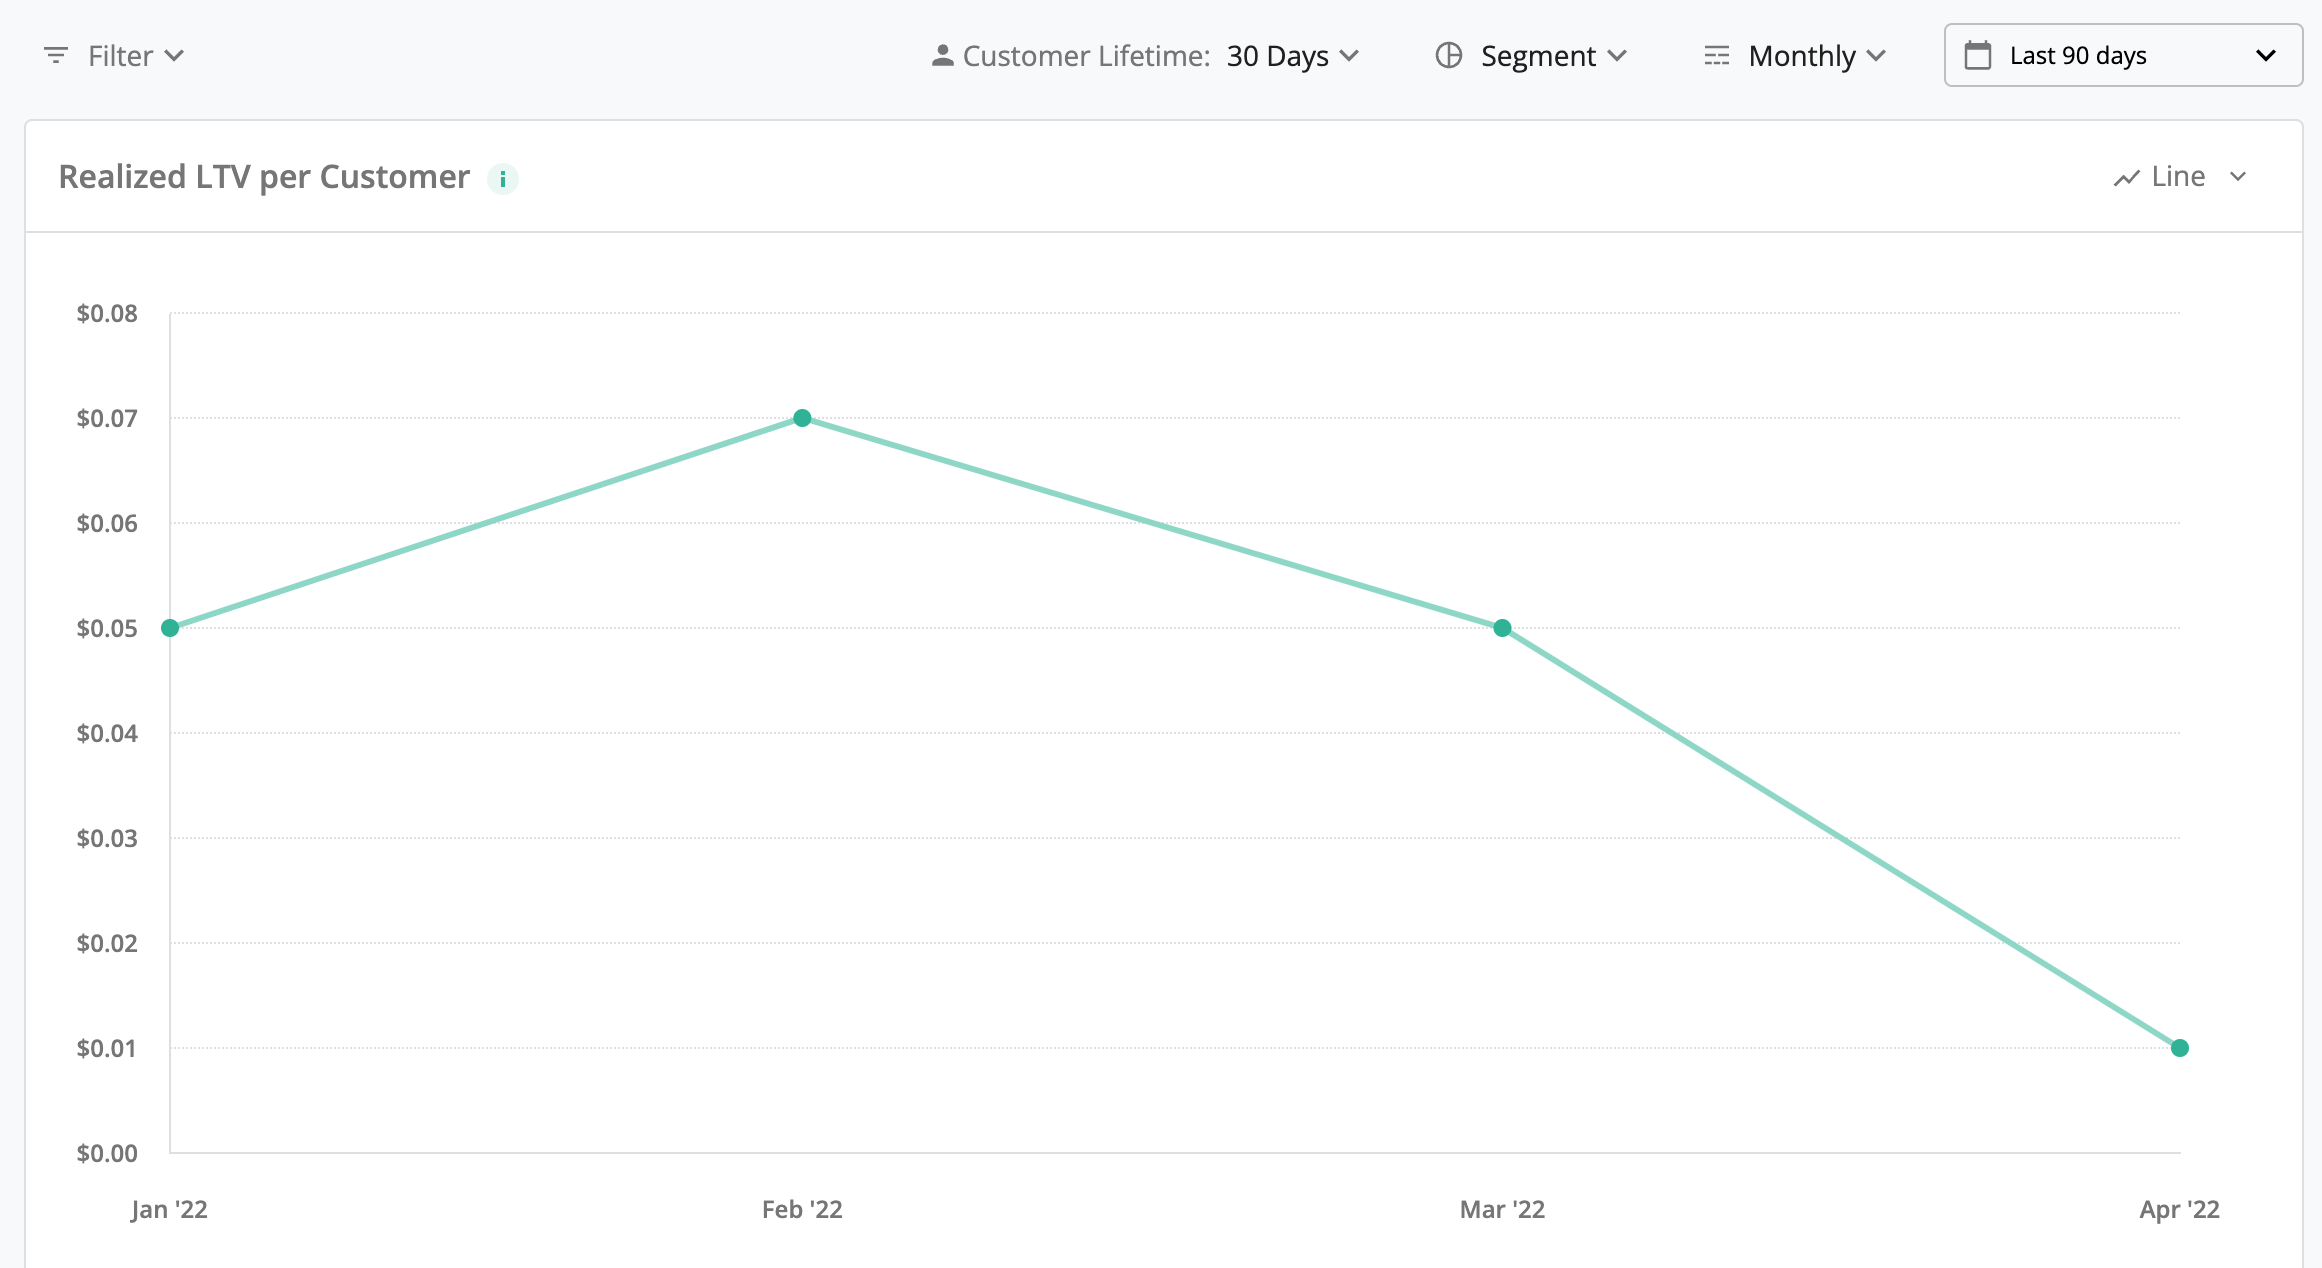
Today, we are launching two new charts showing realized (historic) Lifetime Value (LTV): one for LTV per Customer and another for LTV per Paying Customer. These two realized LTV metrics are also sometimes called ARPU (Average Revenue Per User) / ARPPU (Average Revenue Per Paying User). They shows the actual (gross) revenue that was generated by a (paying) customer cohort, divided by the number of customers in that cohort. Customers are cohorted by the date they were first seen, i.e. the date they first opened your app.
Using the “Customer Lifetime” selector, you can define the time period after the customer was first seen that should be considered in terms of revenue. For example, by setting the “Customer Lifetime” selector to 30 days, all revenue generated by customers in their first 30 days will be added up, and any revenue generated after that will be discarded for the purpose of this chart.
These charts give you an overall view how the monetization of customer cohorts has developed over time. A common use case is to compare a certain customer lifetime (e.g. 30 days) for users acquired in different months. You can then connect the results with what happened in product and marketing during these months. For example, changes to your paywall, App Store / Play Store features, or changes in paid acquisition may change the number of newly acquired customers and/or the average revenue generated per customer.
These charts can also be used as a tool to understand the profitability of (paid) acquisition. By comparing the Realized LTV per (Paying) Customer for a given cohort with the average cost to acquire a (paying) customer for that cohort (Customer Acquisition Cost, CAC), you can calculate the acquisition profitability.
We also launched another smaller update: In those of our charts where it makes sense, you can now toggle the summary column from “Average” to “Total”.