Today, we are launching two new charts to better understand your funnel from newly acquired customer to paying subscriber.
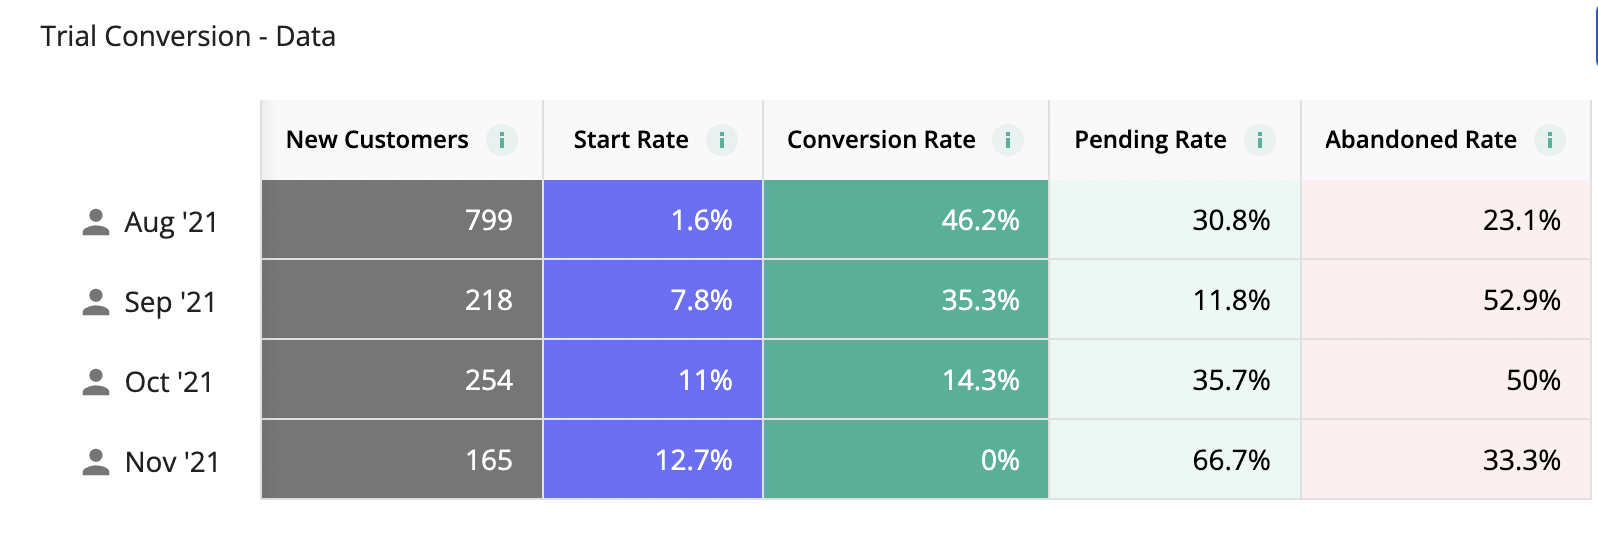
The Initial Conversion Rate chart shows what proportion of each cohort of new subscribers either started a trial or made a purchase without a trial. You can think of it as the proportion of subscribers who took an action on your paywall, or paywall conversion.
The Conversion to Paying chart shows what proportion of each cohort of new subscribers ends up paying (either because they converted from a free trial to paying subscriber, or because they made a purchase without a trial). This can be thought of as the end-to-end view of the conversion funnel within your app.
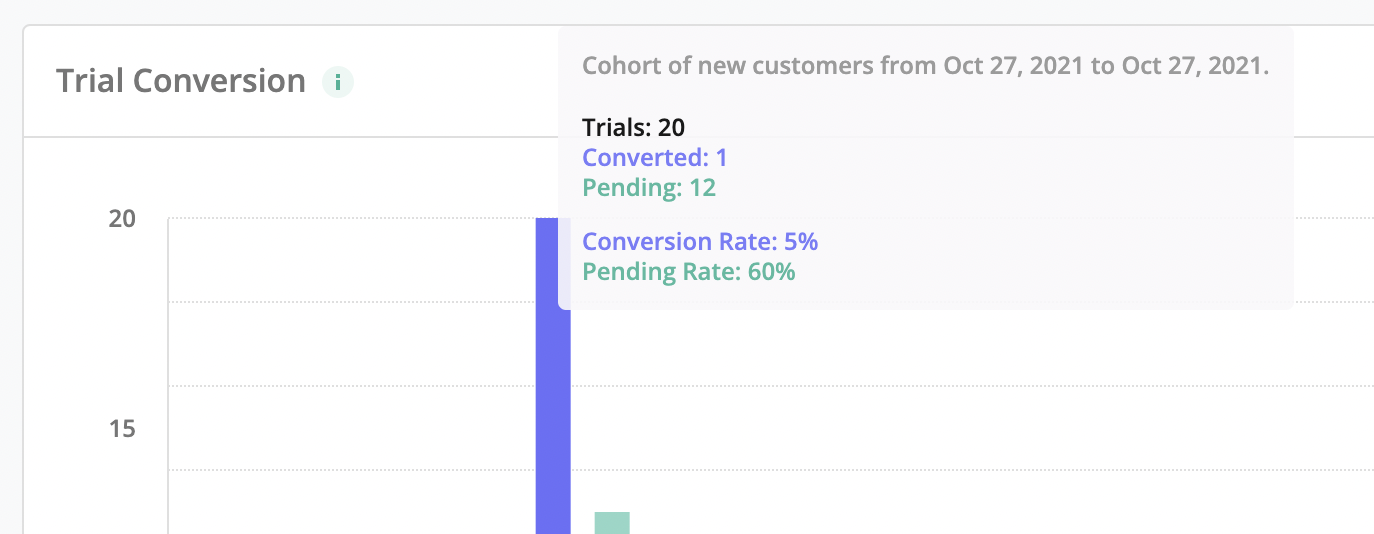
With these new charts, we now offer three views of conversion rates (the Trial Conversion chart remains, of course). Which of these are most useful and valuable to you will depend on your product setup—whether you offer subscriptions with trials, without trials, or a mix of both.
Let us know if you have any questions or comments in the thread below!


