Question

Interpreting A/B experiment results

  • 30 May 2023
  • 3 replies
  • 50 views

Badge

Hello everyone,


we’ve been running various experiments with revenuecat for some time and finally I found myself quite confused as to how to interpret the results.

Setup:

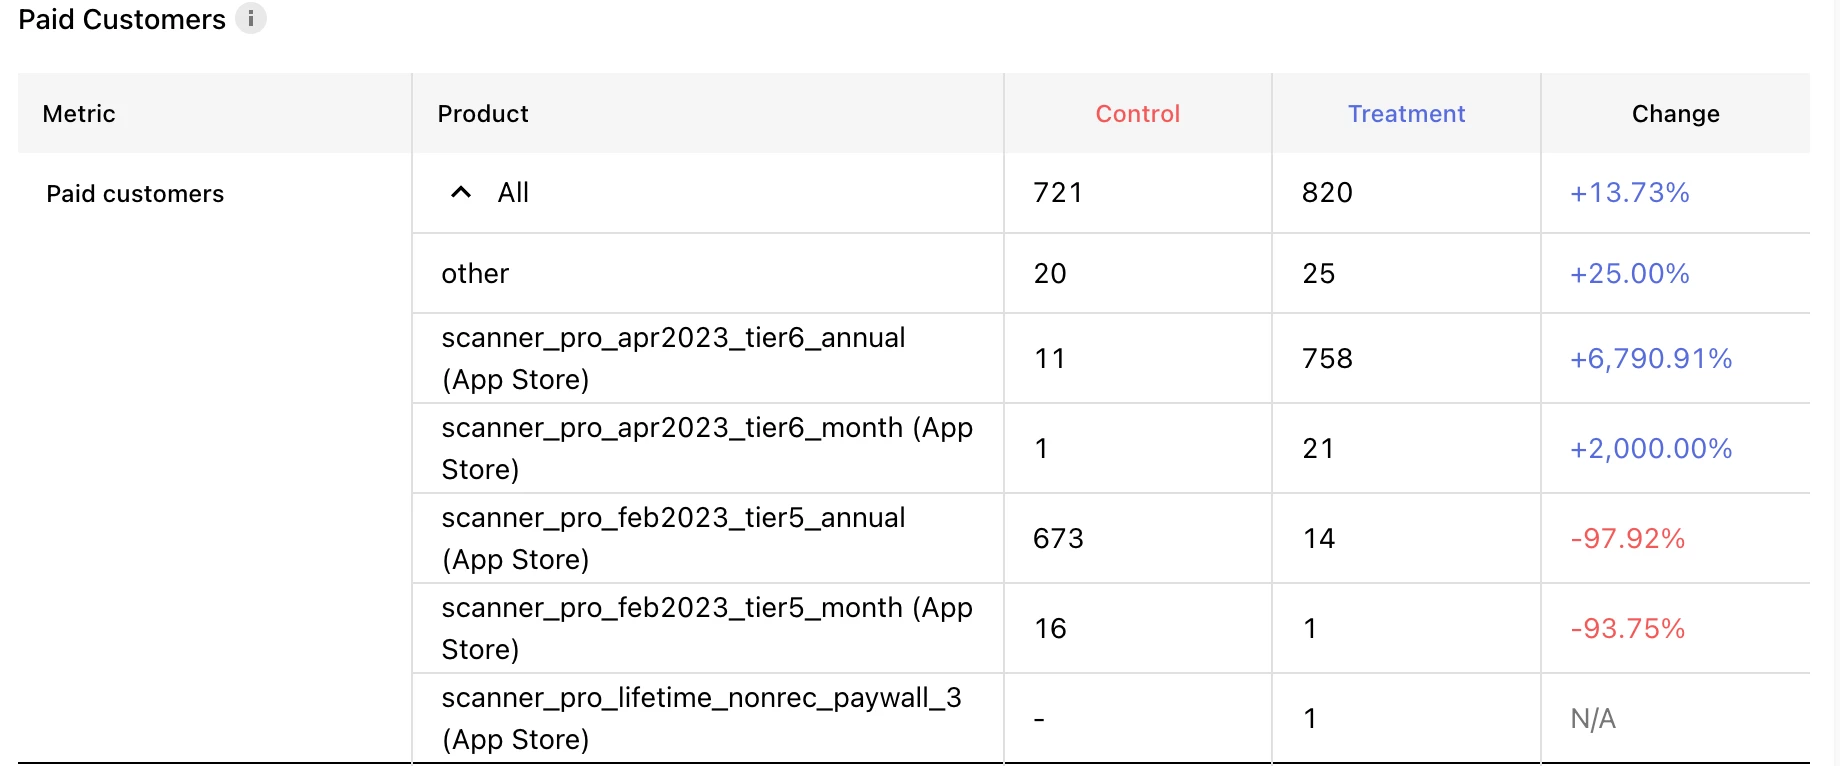
Control: tier5 - has monthly and yearly subscription offerings

Treatment: tier6 - has a different monthly and yearly subscription offerings


Questions

  1. Why are all offerings mixed into both Control and Treatment arms? We clearly separate and would like to test tier5 vs tier6.
  2. Follow up: Why totals include offerings from a competing arm? E.g. Treatment arm (tier 6) is 820 in total and includes 14 yearly offerings from tier5?

I’ve read through all the articles and discussions, but can’t really get it. Would really appreciate any insight here.


3 replies

Userlevel 3
Badge +8

Hi,

1. Was this a long-running experiment? We did have an issue with customers who got aliased/transferred (see restore behavior), but that was a few months ago.

Alternatively, this mixing sometimes happens when subscriptions are in the same subscription group (for iOS), promoted in the store, or the “current” offering identifier isn’t used, and the offerings are shown some other way.

I’d suggest opening a support ticket so we can dig into some specific users and see what happened.


2. That is also related to the users being shown the unintended offering. Because they were able to purchase it, we still sum it in the column for the model to work. Ideally you should have a clean split (i.e., zeros in those rows)

Badge

Thanks Ryan - 

this is a pretty consistent behaviour across multiple experiments we ran over the course of the last 3 months. Each of the experiments is roughly a month long. Thanks for the confirmation that something is not right, I have filed a ticket.

Userlevel 3
Badge +8

Perfect, I see that ticket in our system. We will review and reach out to you shortly

Reply