

We currently have an AB test running, but the results seem confusing. The tests shows the following numbers:
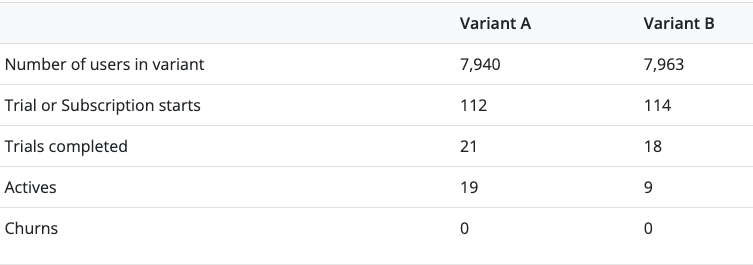
Variant A has an annual price of $49.99 and Variant B $59.99. From this, it seems more intuitive to me that Variant A is outperforming because the price of B is only 20% higher than A’s, but there are more than double the amount of active subscriptions in Variant A.
Yet, the results section suggests:
“Based on our most recent run of the model, at 1 years, there is a 67% chance that Variant B has a higher LTV.”
Can you explain to me where this result comes from? Maybe there’s just a lack of additional data in the dashboard that would show the real reason, but with the data available, it seems very off for us.
Thanks


