Solved

AB results wrong?

  • 23 November 2021
  • 2 replies
  • 166 views

Badge +5

We currently have an AB test running, but the results seem confusing. The tests shows the following numbers:


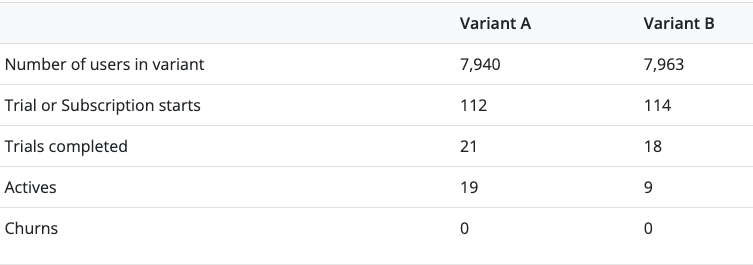
Variant A has an annual price of $49.99 and Variant B $59.99. From this, it seems more intuitive to me that Variant A is outperforming because the price of B is only 20% higher than A’s, but there are more than double the amount of active subscriptions in Variant A.


Yet, the results section suggests:
“Based on our most recent run of the model, at 1 years, there is a 67% chance that Variant B has a higher LTV.”


Can you explain to me where this result comes from? Maybe there’s just a lack of additional data in the dashboard that would show the real reason, but with the data available, it seems very off for us.


Thanks

icon

Best answer by ryan 23 November 2021, 17:23

View original

2 replies

Userlevel 5
Badge +9

67% is still pretty close, I’d recommend running the experiment longer to try and increase the confidence in one variant or the other. Only 18 out of 114 trials have completed in Variant B so there may be a lot of “potential” revenue the model is still considering. 

There’s some more info on the underlying model in this blog post here that may be helpful: https://www.revenuecat.com/blog/price-testing-for-mobile-apps


Badge +5

Ok that does make sense. It would be helpful, if the data points available would have a bit more context information. For example, it isn’t clear whether (in Variant A):

  • the 91 users who started but haven’t completed yet cancelled the trial already or what there status is?
  • Are people who cancel the trial showing up in the churned row?
  • and so on.

It’s a bit unclear what the rows actually mean, whether it’s a funnel or if they are inclusive / excklusive numbers etc. Maybe there could be a bit more tooltip information in the dashboard.


And thanks for the article!

Reply