Hi there,
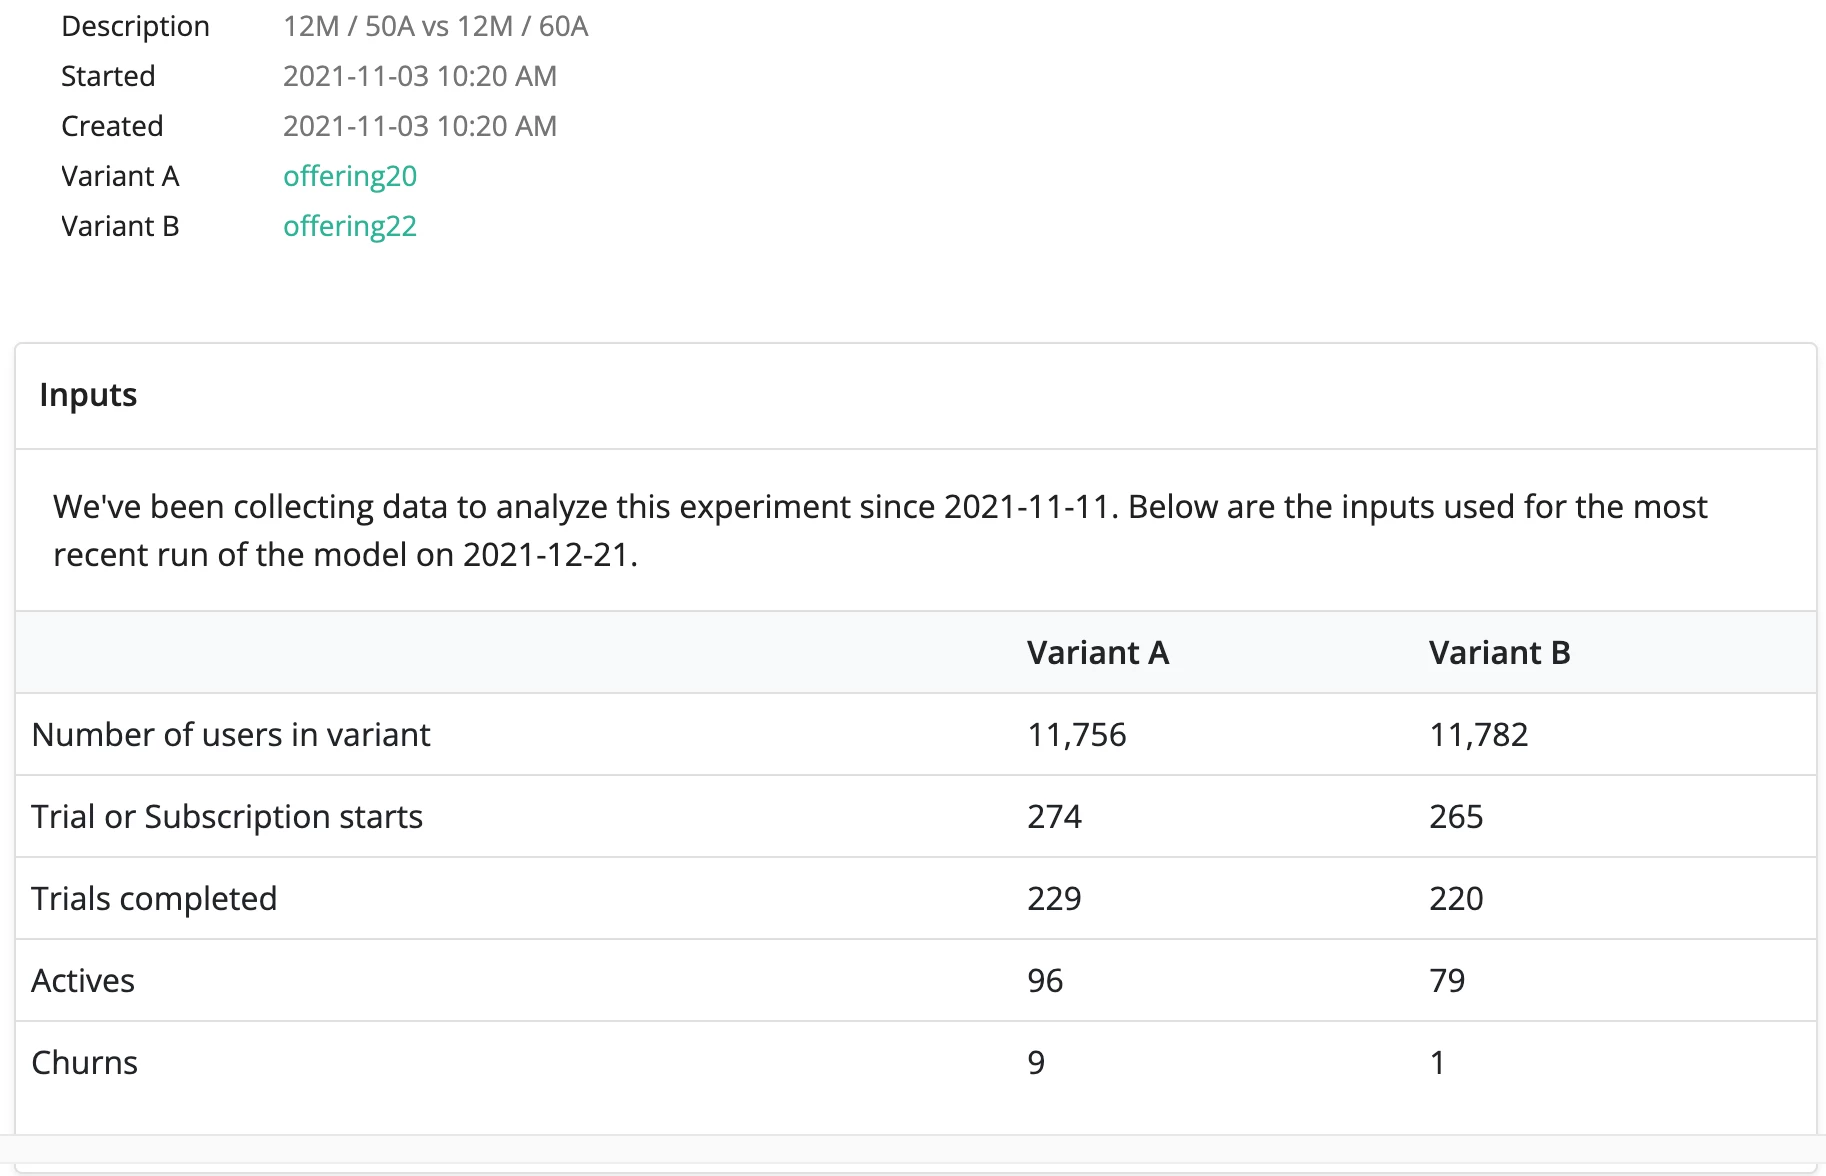
we’ve been running an experiment with two different annual prices for over a month now:
- Variation A: $12/mth and $50/year
- Variation B: $12/mth and $60/year
We noticed the following behavior:
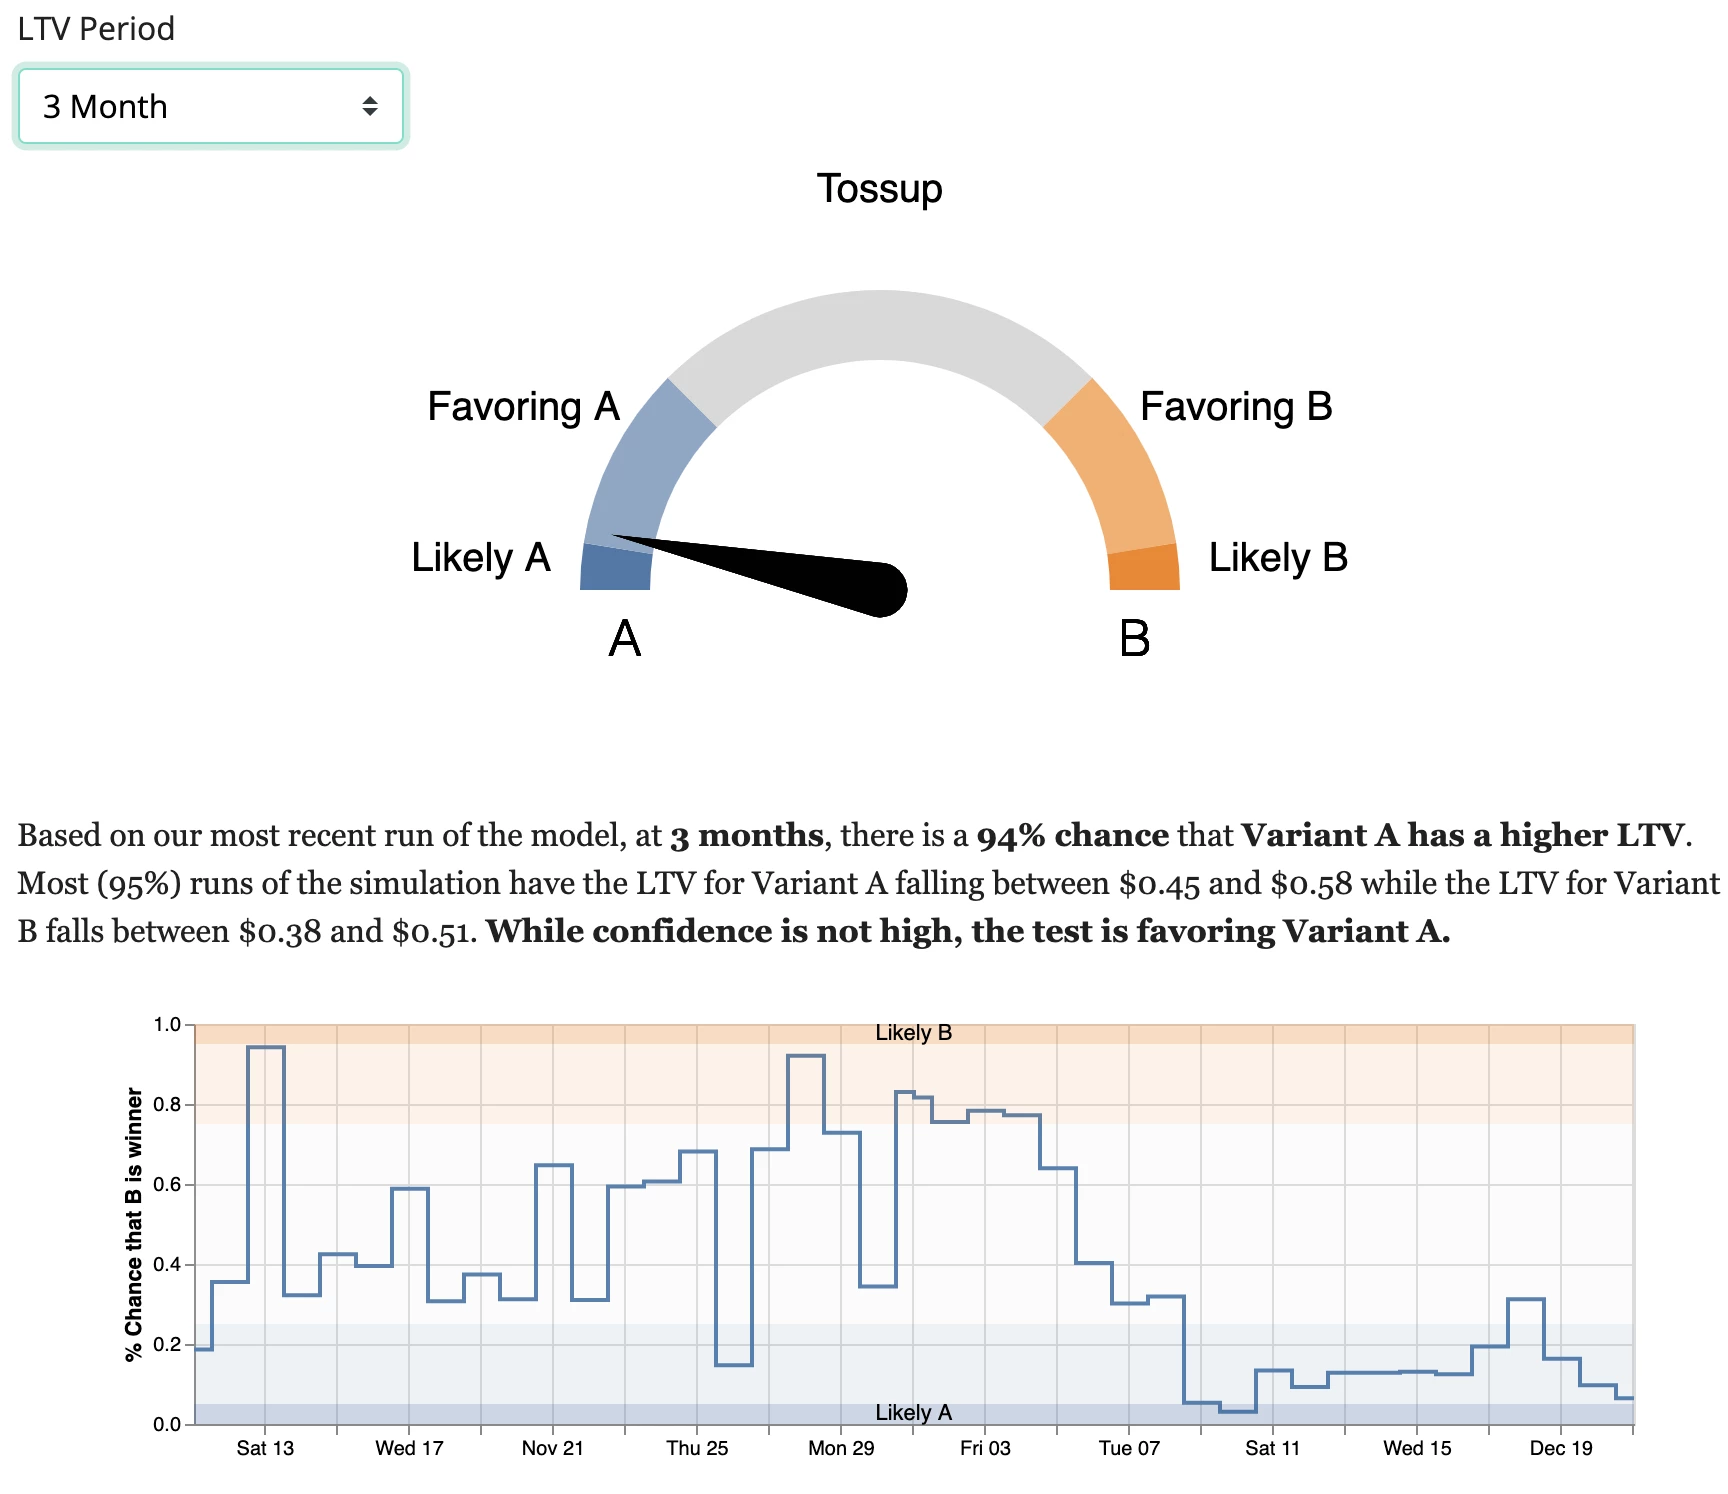
- The test has always been close, but slightly favoring Variation B for the first 4 weeks
- Then after the first month was over and the first set of monthly subscriptions were renewing / churning the test completely shifted towards favoring Variation A
So now we are wondering what happened and whether we’d need to wait for 11 months more and once the annual subscriptions start to renew, the picture would look completely different again.
How confident can we be that these results are reliable and we should get rid of Variant B now?
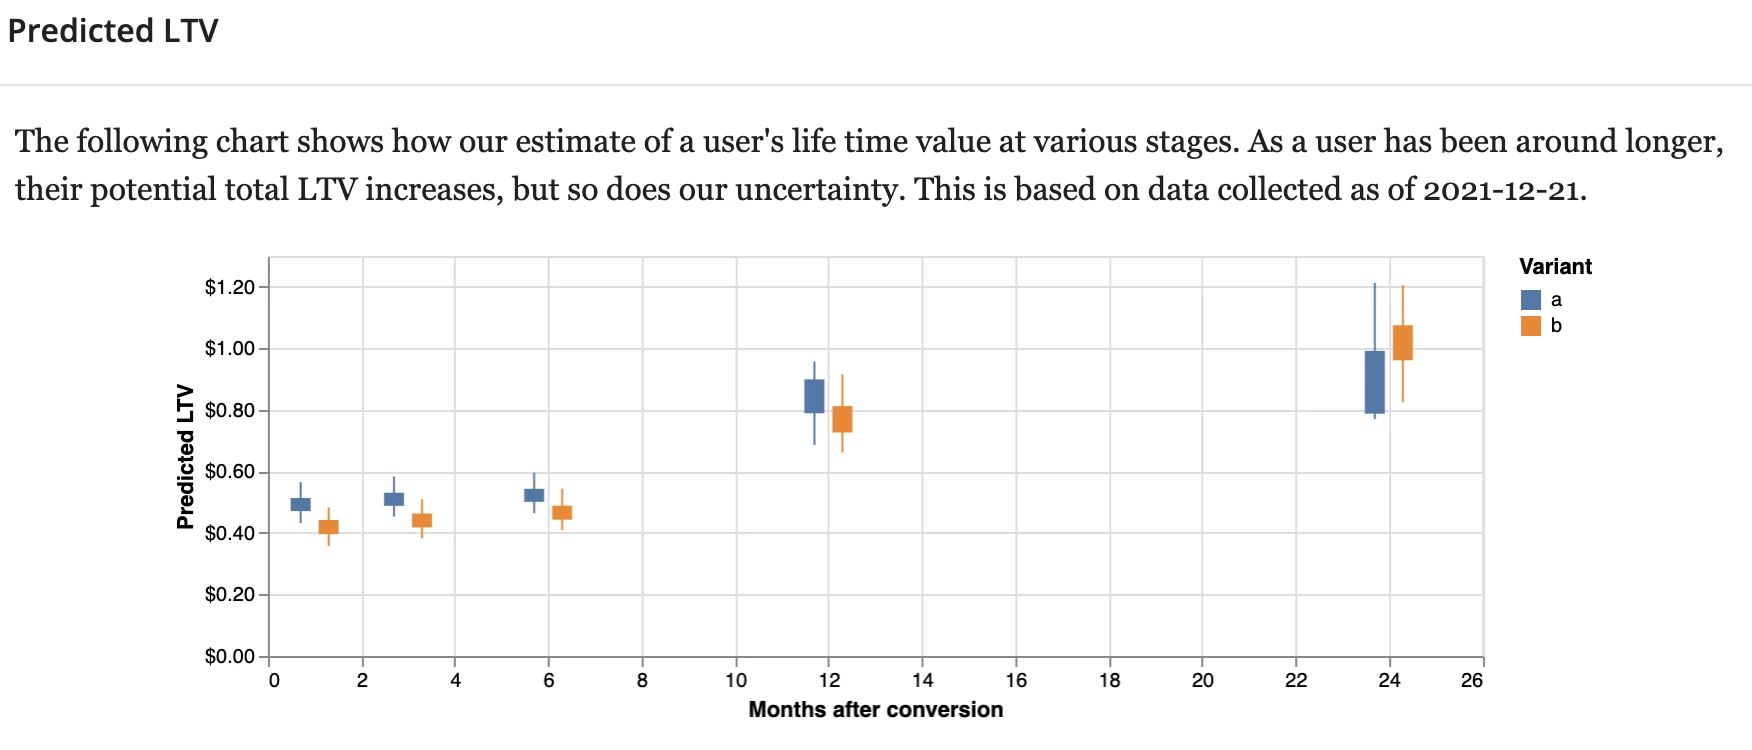
Also is it possible to get some more insights into the breakdown of the collected data for the tests? Since those tests are very important and the prediction model is somewhat of a black box, it would be very nice to see how many monthly vs annual subscriptions were started / converted / churned in each variant? How much revenue did each variant generate so far? And so on. The table and charts don’t really tell you a lot about the outcomes, which is one of our main concerns for testing pricing only via RevenueCat since we cannot look at the core numbers for each variant, we only get a few high level descriptive numbers.
It would be very nice if you could shed some light on what’s actually going on there.
Here are some screenshots from our tests:


