Solved

AB experiment favoring variants with actual renewal data?

  • 21 December 2021
  • 3 replies
  • 117 views

Badge +5

Hi there,


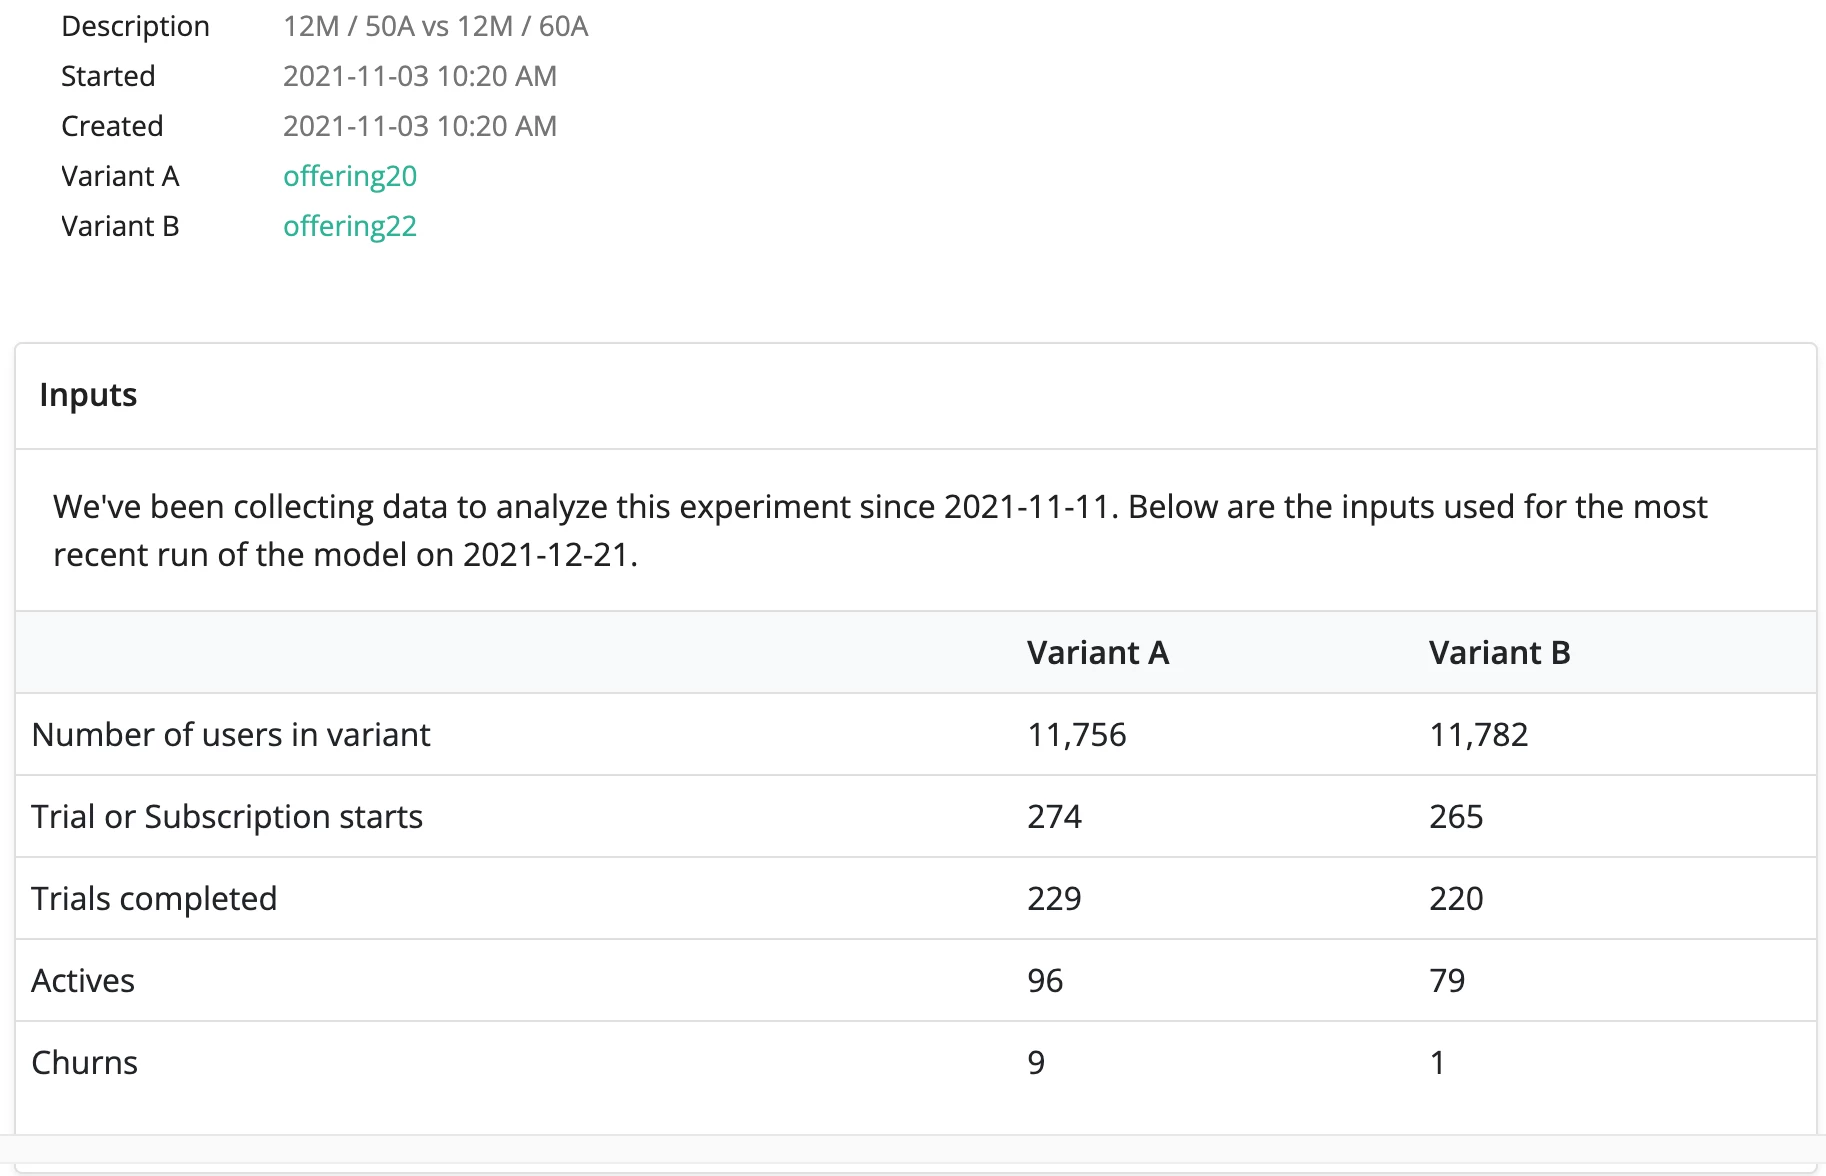
we’ve been running an experiment with two different annual prices for over a month now:

  • Variation A: $12/mth and $50/year
  • Variation B: $12/mth and $60/year

We noticed the following behavior:

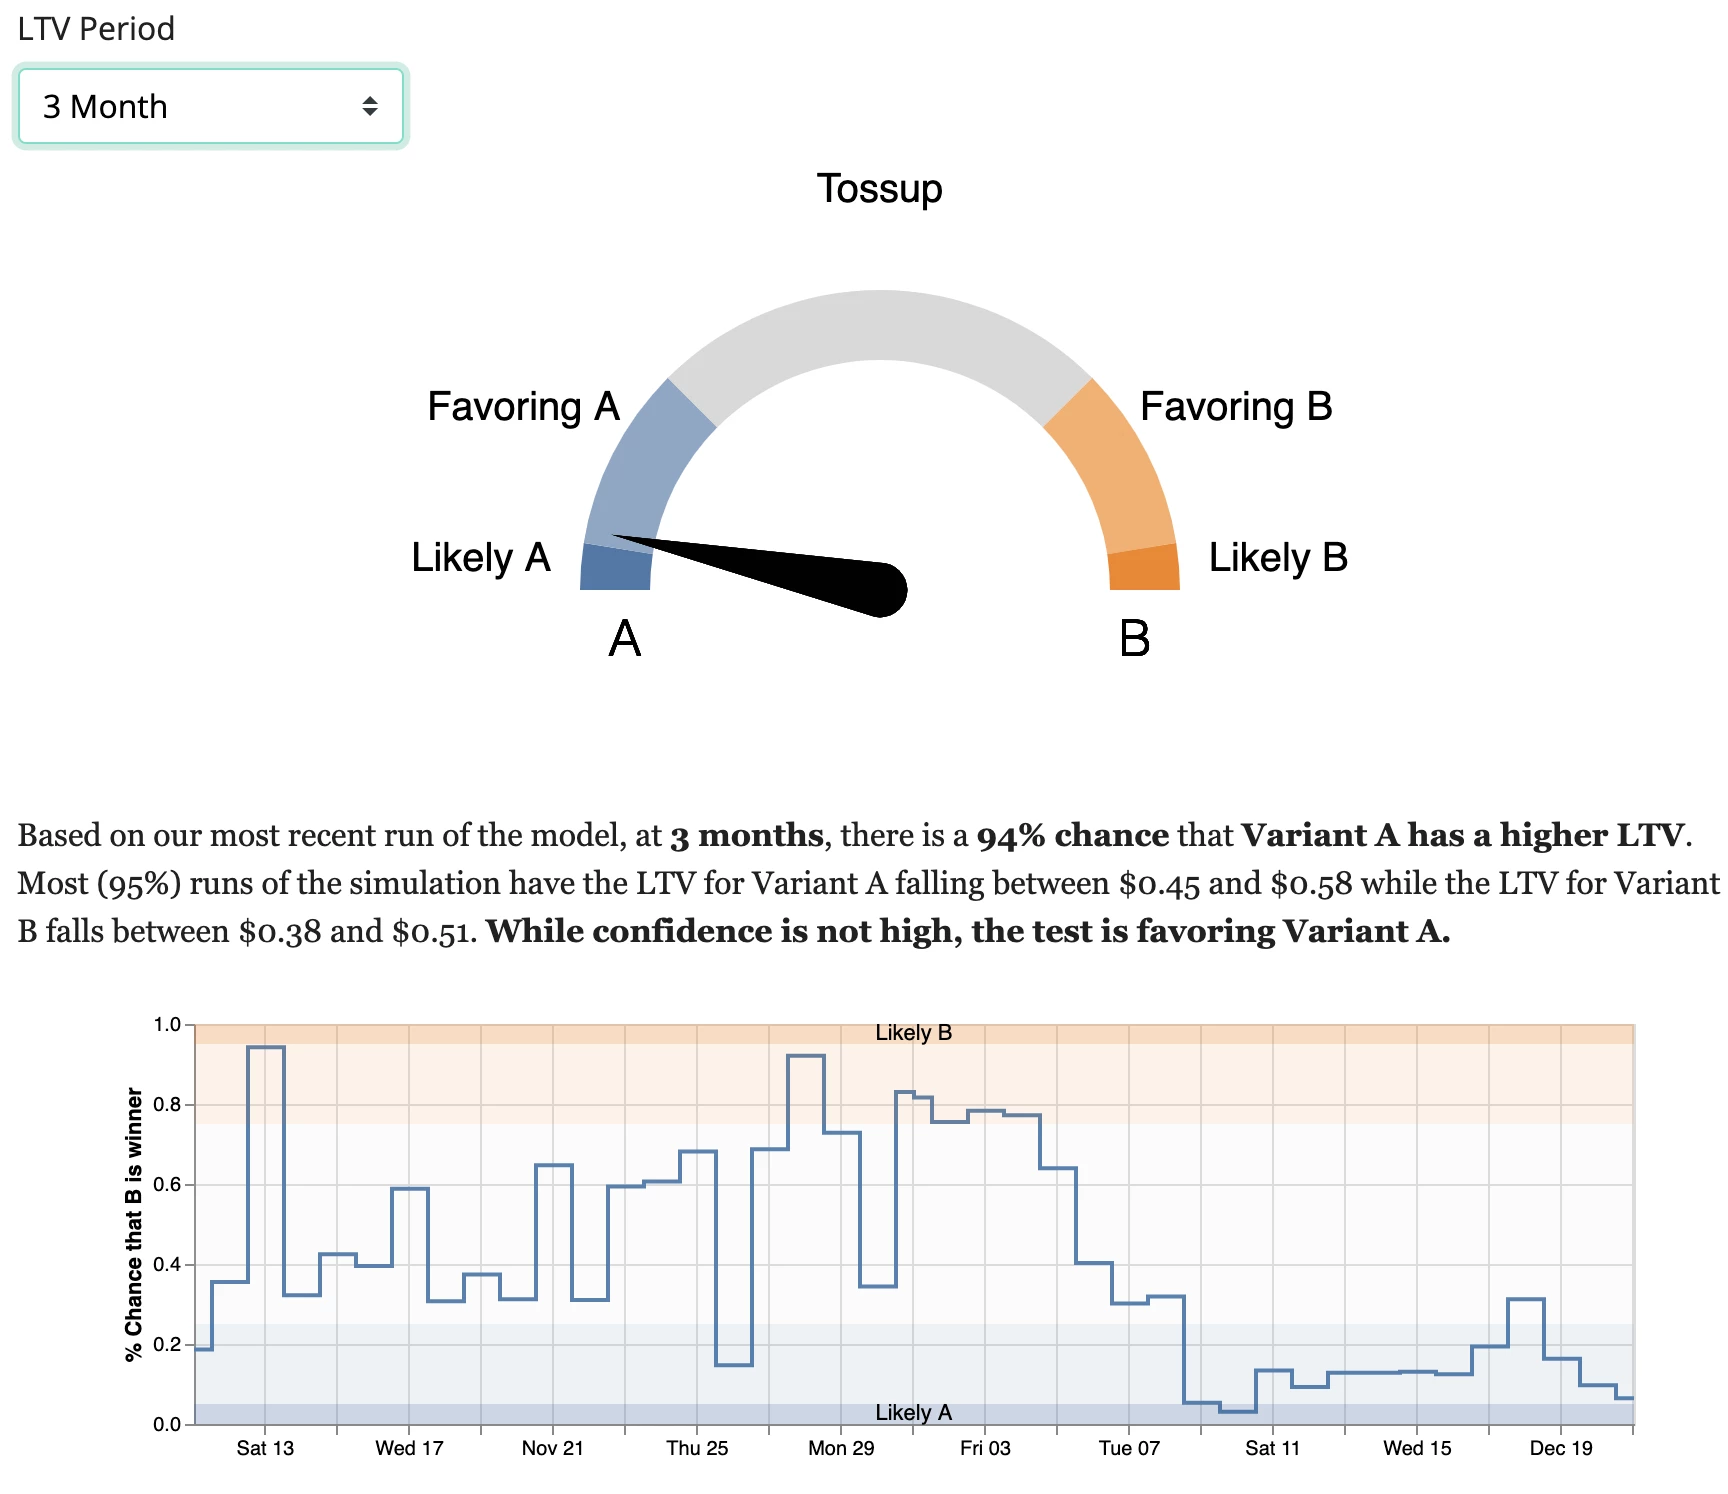
  • The test has always been close, but slightly favoring Variation B for the first 4 weeks
  • Then after the first month was over and the first set of monthly subscriptions were renewing / churning the test completely shifted towards favoring Variation A

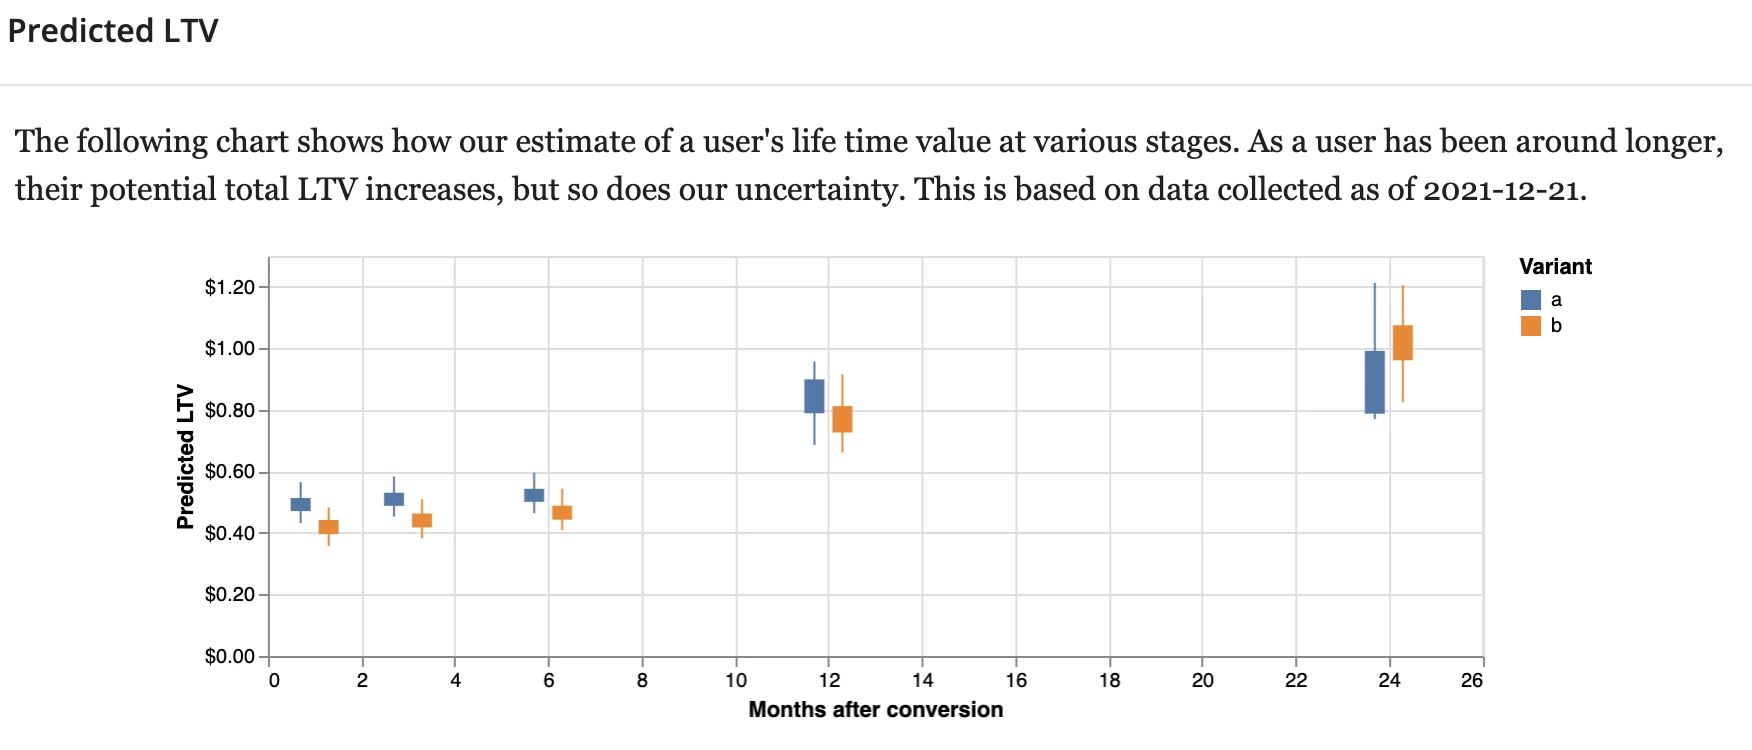
So now we are wondering what happened and whether we’d need to wait for 11 months more and once the annual subscriptions start to renew, the picture would look completely different again.

How confident can we be that these results are reliable and we should get rid of Variant B now?

Also is it possible to get some more insights into the breakdown of the collected data for the tests? Since those tests are very important and the prediction model is somewhat of a black box, it would be very nice to see how many monthly vs annual subscriptions were started / converted / churned in each variant? How much revenue did each variant generate so far? And so on. The table and charts don’t really tell you a lot about the outcomes, which is one of our main concerns for testing pricing only via RevenueCat since we cannot look at the core numbers for each variant, we only get a few high level descriptive numbers.

It would be very nice if you could shed some light on what’s actually going on there.

Here are some screenshots from our tests:


icon

Best answer by tina 7 January 2022, 00:10

View original

3 replies

Userlevel 5
Badge +10

Hey @aumio 

Since you have both monthly and annual products in each variant, the LTV model calculates each variant is generating more revenue. We have a blog post that overviews our LTV formula that’s worth checking out: https://www.revenuecat.com/blog/price-testing-for-mobile-apps 

Pasting a snippet for convenience: 

The LTV of a cohort is equal to the sum for all products of the trial start rate for that product (c), times the trial conversion rate for that product (τ), the average number of renewals for that product (μ), and the price of that product (p). 

Currently the monthly subscriptions renewing in each cohort would be the driving factor for your Experiments results. Once annual subscriptions start to renew, keep an eye out on the gauge. It would be good to leave the Experiment running until you start seeing annual renewals coming in. 

If you wish to take a look at the underlying transaction data for each cohort in more detail, you can set up ETL exports to get a daily data dump of your apps’ transactions. There’s a column named presented_offering that you can use to filter Experiment transactions. Keep in mind that only new customers after you started the Experiment will be added to cohorts. Meaning existing customers that have downloaded the app before the Experiment was started will only be seeing your current offering configured in the RevenueCat dashboard. 

Badge +5

Hi @tina,

thanks for your reply! The thing is that right after the first few monthly subscribers renewed the experiment started favoring variation A and has stayed like this for almost a month now. So according to the article, that’s a good indicator that A is the winner.

However, we are testing different prices for the annual subscriptions and, of course, not a single annual subscription was able to renew so far. So we are just uncertain whether the results would change drastically again once annual subscriptions renewed?

Because as far as I understand, the model works with “a priori” probabilities and then updates the probabilities with data from the experiment. But could it be the case, that the model now uses real data for the monthly subscriptions but still the same generic “a priori” probabilities for the annual subscriptions?


Thanks

Simon


Userlevel 5
Badge +10

Hey @aumio 

Have you checked out this article yet?

The two variants are fairly similar to each other, in this case you can either test for a much bolder change or leave the experiment running until the LTV period chart is consistent and does not fluctuate. I would recommend checking out the article I linked above, which does into more detail how to read the charts and tips on when to stop an experiment. 


Reply