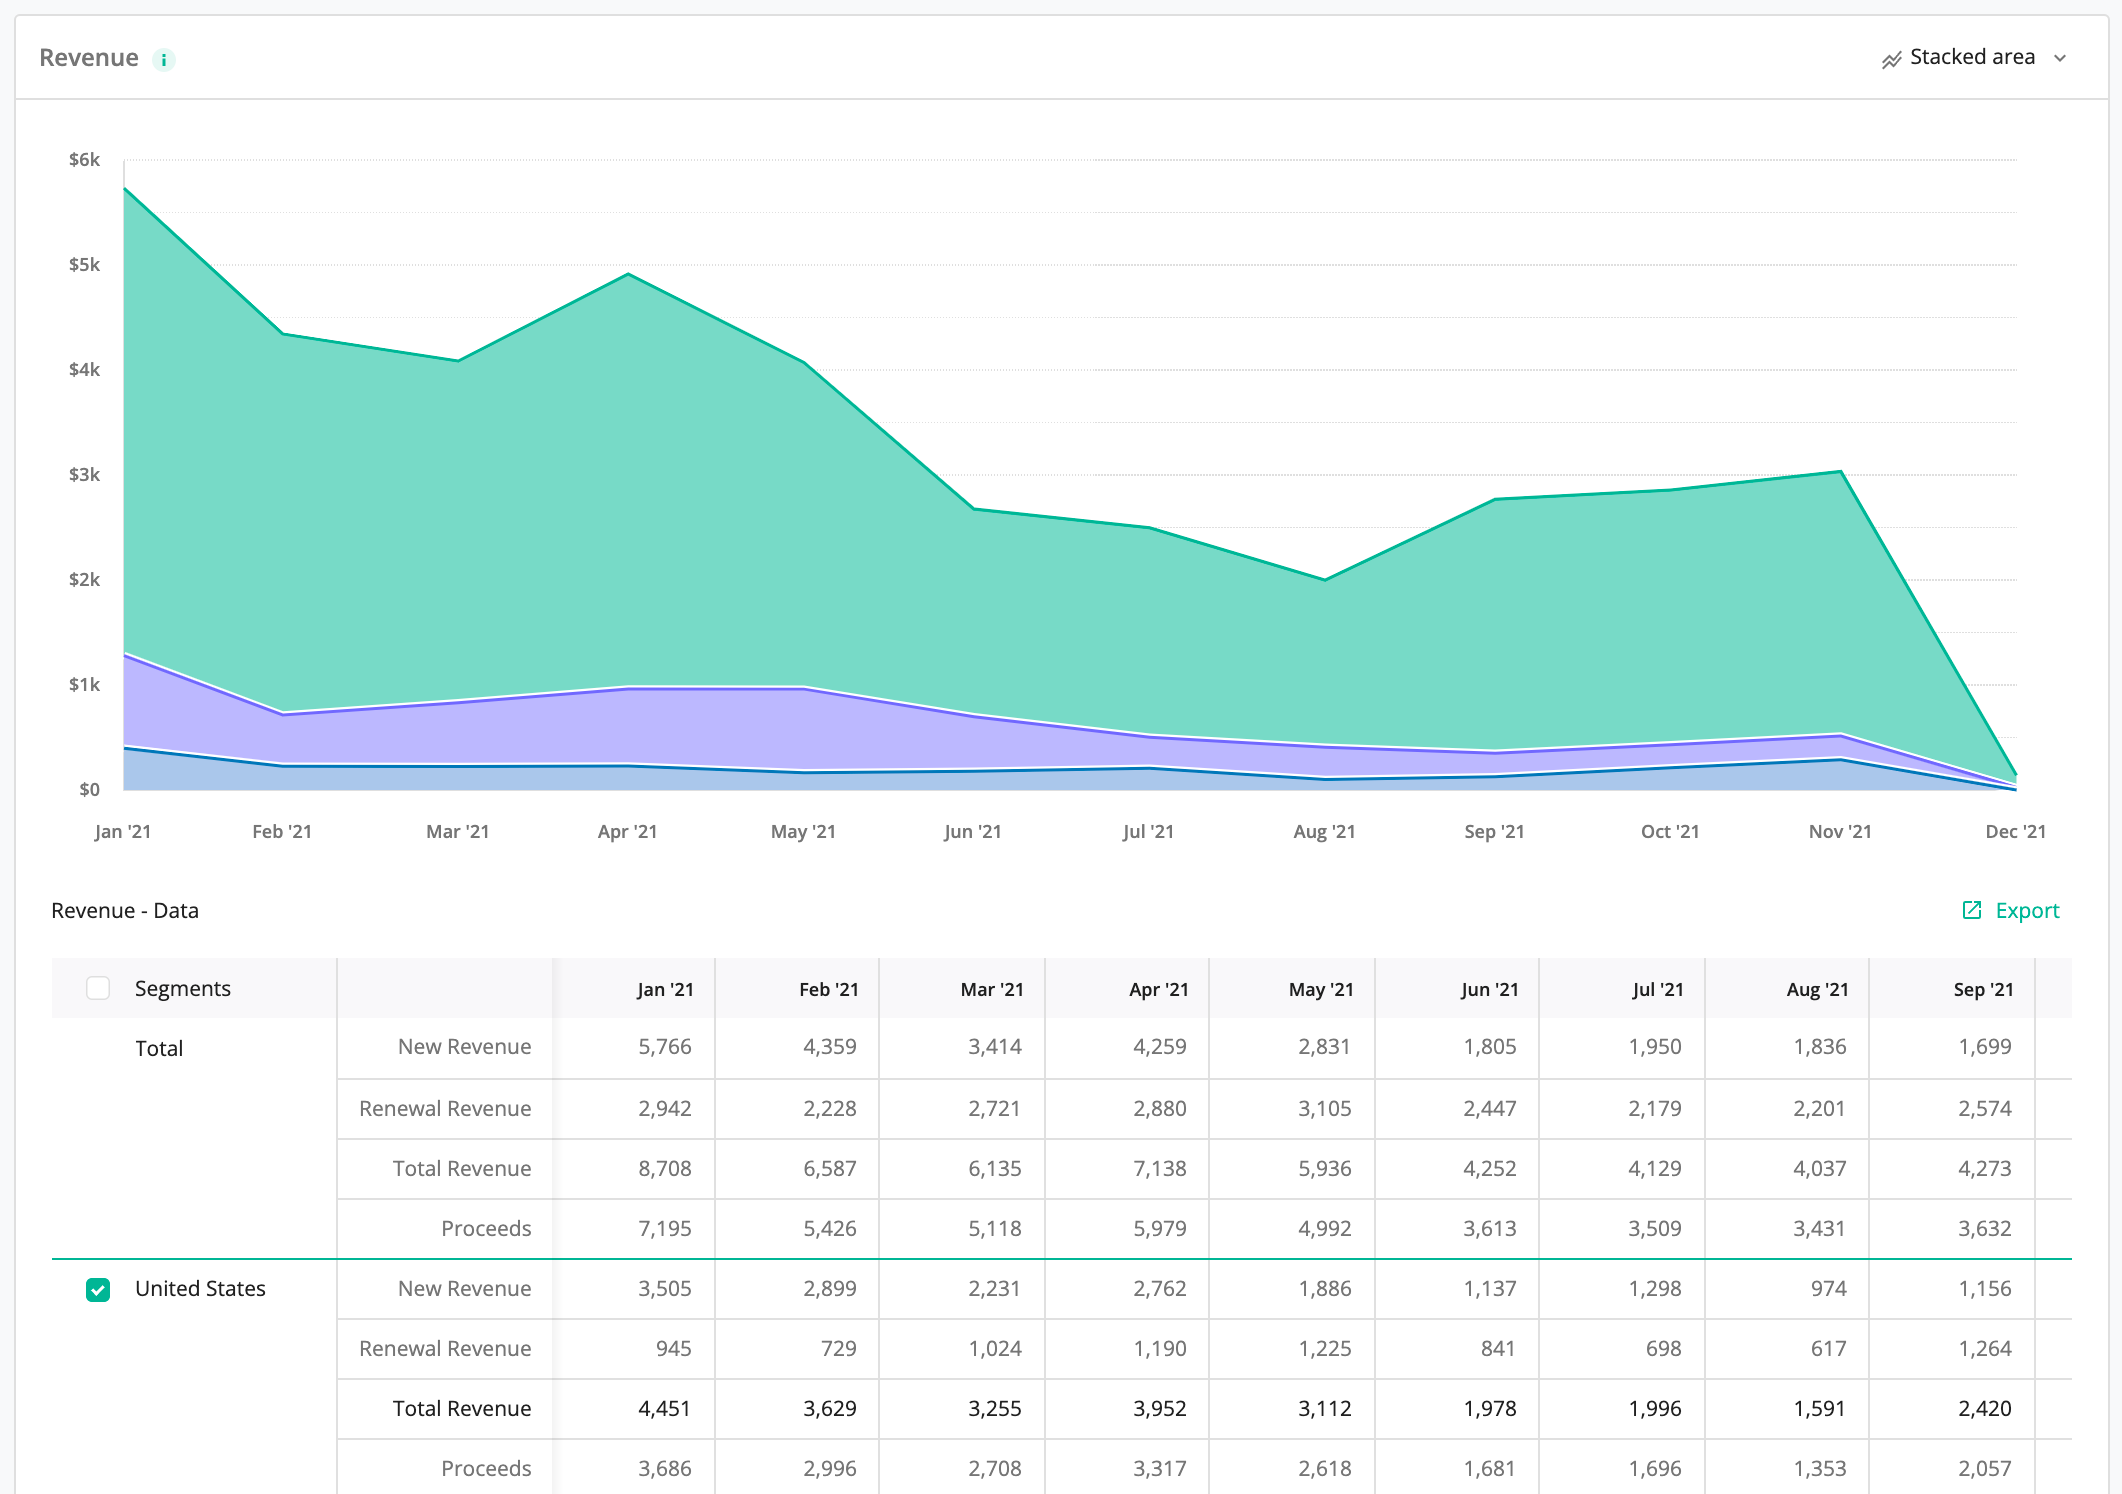
We recently shipped another big update to the RevenueCat charts: Charts now show all measures in the data table even when segmenting. For example, if you segment the Revenue chart, the data table will show not just the total revenue per segment, but also new vs. renewal revenue as well as proceeds. Previously, the only way to get to this information was to filter the chart for each segment individually.
This makes segmentation of RevenueCat charts an even more powerful tool, unlocking a ton of insights that were previously hard to get to.


