There are a variety of things you may want to test about your iOS products: different pricing, free trial durations, introductory offers, and more. The RevenueCat Experiments feature will automatically divide your new customers evenly into two groups, where each group will have a separate “current” Offering. For more information about this feature: https://docs.revenuecat.com/docs/experiments
Bear in mind that this feature is currently in Beta and A/B testing is available on iOS only. When deciding to make an Offering current, double check that it works on all platforms supported by your app. This means while the experiment Offering will be available for customers on other platforms, the data is only calculated for iOS purchases.
How often do Experiment results get computed?
The LTV model is ran daily, typically every 24 hours after you first initiated the experiment.
What to do when seeing the 'Data will show in 24 hours' message after 24 hours?
If it has been well over 24 hours since you started the experiment and are still seeing the 'Data will show in 24 hours' message, there are a few places to check before reaching out to the Support team:
-
Ensure that all products in the two Offerings variants are approved for sale in App Store Connect.
-
If all products are approved and populating on your paywalls, you should make sure your products have been purchased before. If there are products part of your Experiment that have not been purchased yet, you can either wait for a production transaction to come through for that product or purchase these products directly in the development build (sandbox testing).
-
When purchasing subscription products with a trial or introductory period attached, ensure you have at least one renewal on the RevenueCat dashboard.
How do sandbox transactions affect Experiments?
RevenueCat does not have a concept of "sandbox users", since a user can have both sandbox and production purchases associated with them. As a result, sandbox users will also be shown one variant or another. However, any sandbox purchases will be filtered out and will not be calculated in your experiment results.
Are lifetime products included in Experiment results?
Yes! Lifetime products are accounted for in LTV calculations. The purpose of Experiments is to determine which variant will generate more revenue over its lifetime, therefore RevenueCat considers all product durations in the Experiment when calculating results.
When do I stop an Experiment?
A good indication when you can conclude an Experiment test is when your LTV chart becomes consistent and does not have wild fluctuations between variant A and B. Example chart:
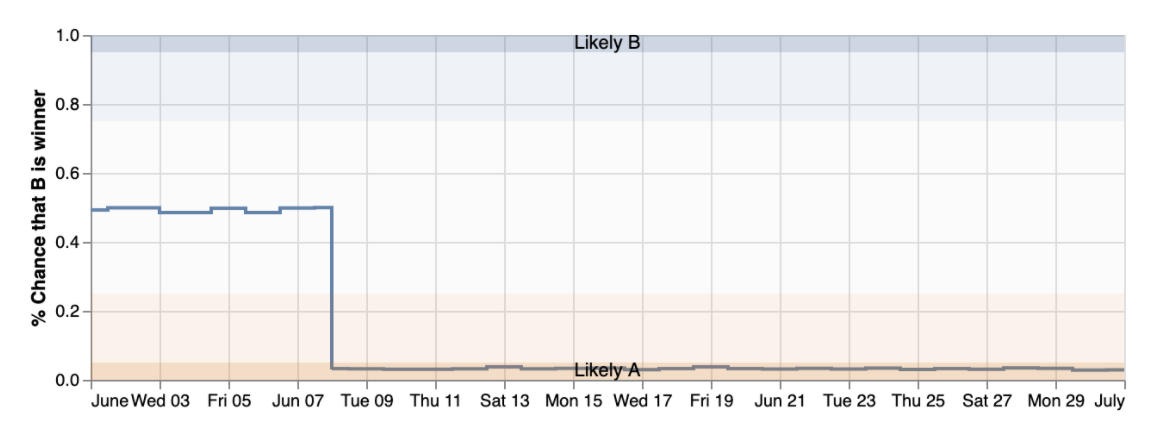
Figure A: In this example, it is clear that variant A is the winner
However, every app and every A/B test can be different and does not always have a clear winner.
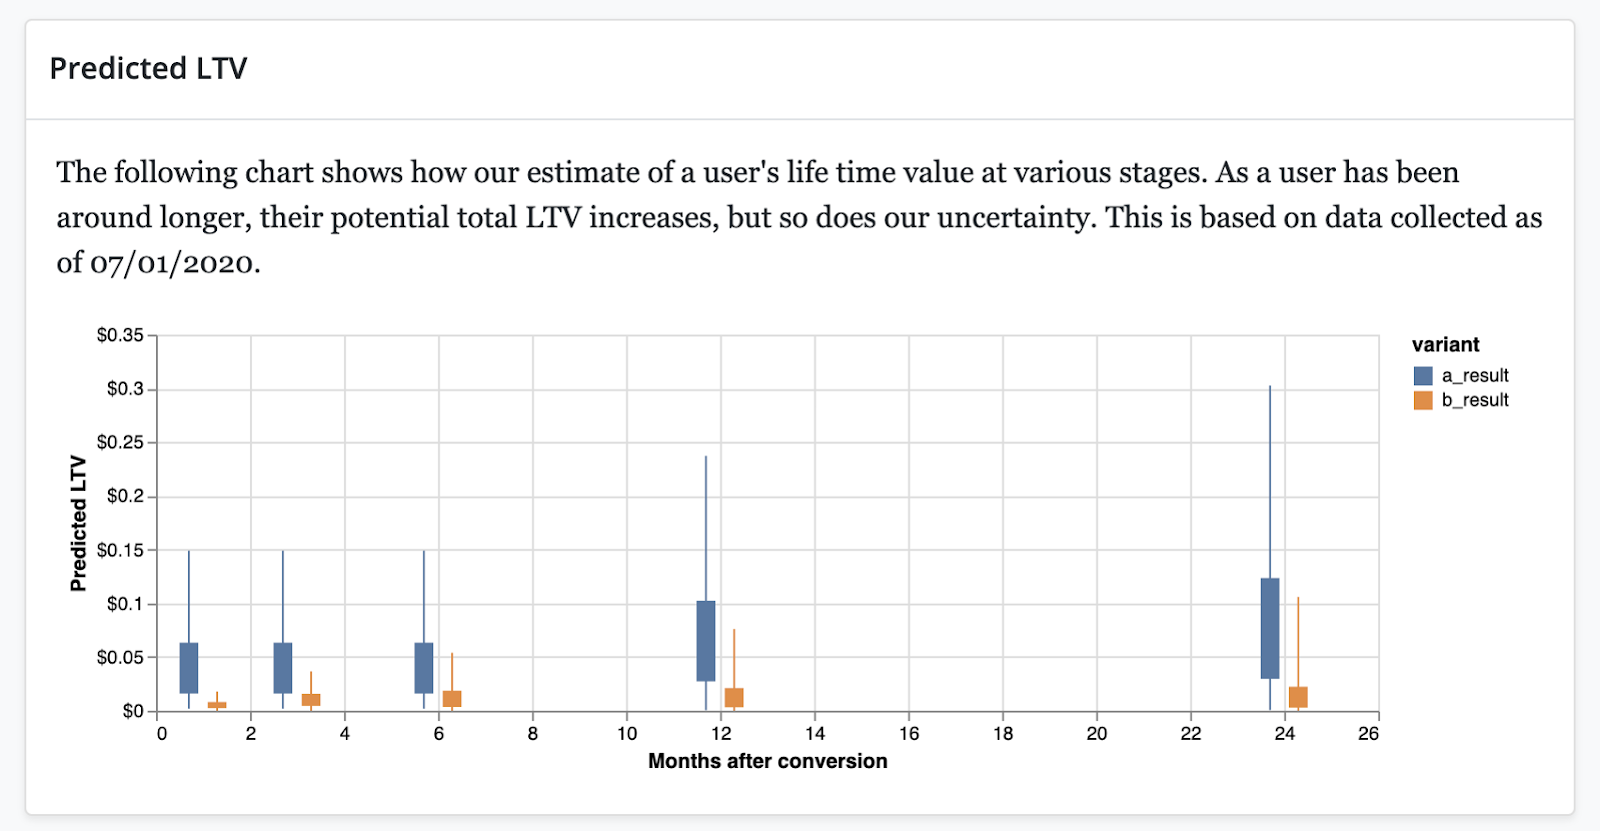
Figure B: Long whiskers represent uncertainty in the variants for these time periods. No boxes overlap for all month predictions indicate LTV was not similar between variants.
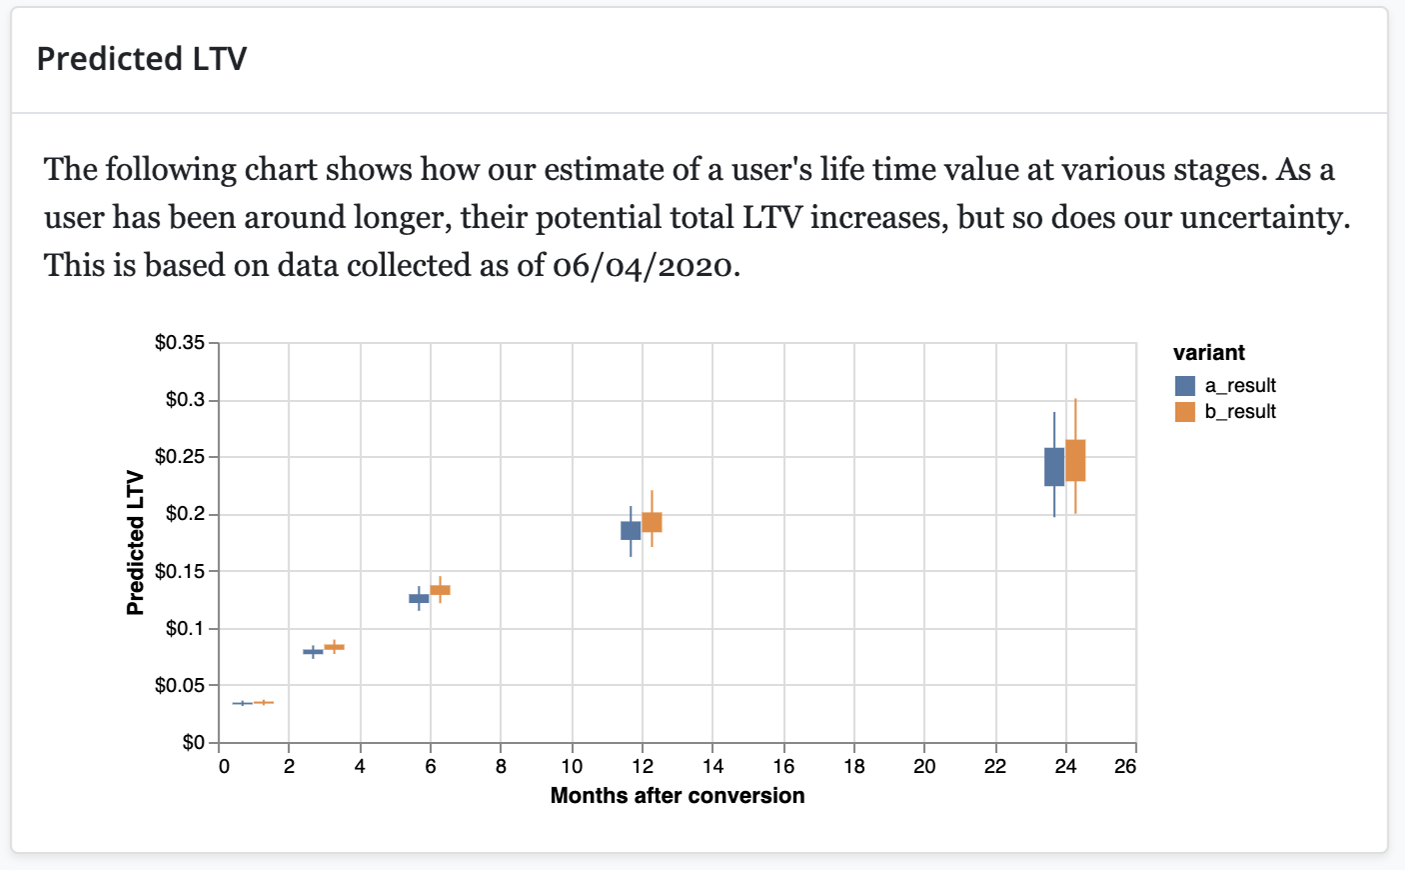
Figure C: Short whiskers represent certainty for the variants in these time periods. Boxes overlap for the 12 month and 24 month predictions indicates a tossup.
The Predicted LTV chart (aka box and whiskers chart) can be used to analyze the LTV model’s uncertainty and tossups. If the whiskers are long (figure B), that means the model is uncertain, which causes the LTV gauge to fluctuate between the two variants. You should look for the time period with the shortest whiskers (figure C) and focus your LTV gauge on that time period.
On the other hand, if two boxes overlap with one another (as seen in figure C for 12 and 24 months predictions), this indicates a tossup and the model was not able to determine a clear winner. This happens when the two Offerings result in a similar LTV, therefore the LTV gauge is somewhere in the middle of the two variants. You should look for the time period with the least overlap between boxes (as seen in figure C for the 3 and 6 month predictions) and focus your LTV gauge on that time period.
If the changes you are testing for are too small, it may take a longer time in order to reach significance. Bigger changes will validate quicker, so try bolder changes to start triangulating your optimal price, duration, trial periods, etc. However, ensure that you only test one variable at time per Experiment, otherwise the results will not be clear.
What are best practices when setting up Experiment products?
After concluding Experiment results, you may want to remove the “losing” test product from your paywall and prevent it from being bought in the future. You may have noticed the option to clear a product from sale in App Store Connect. While this seems like the ideal solution, unchecking ‘Cleared for Sale’ means the in-app purchase will be removed from sale AND existing subscribers will not be able to renew this subscription. If you desire this result, feel free to stop reading this section (or continue if you’re curious).

Now, you may be asking yourself: what can I do to hide the product from sale AND have existing subscribers continue renewing? The short answer is to use different subscription groups. After a customer purchases a product within one subscription group, they have visibility to other products in the same group via the Settings app. In order to prevent customers from seeing products from both variants via the Settings app, you will need to place your new products for your Experiment into a different subscription group before starting the Experiment.
As an example of this, you could have 1 Offering that has weekly_a, monthly_a, and annually_a in one subscription group and you’d want to put your 2nd Offering containing weekly_b, monthly_b, and annually_b in a separate subscription group. Once the Experiment is done and you have decided the clear winner, all that is left to do is update your “current” Offering in the RevenueCat app settings page to the winning variant or run a new Experiment to further optimize your LTV.
For additional reading on subscription groups:
Additional reading on A/B testing and results: