I’m exporting data to try and measure revenue performance of ASA campaigns to work out overall ROAS but the revenue export is unusable and just shows my ad groups as 357 columns. These can’t be added to a pivot table and can’t be aggregated without manually going through and manipulating the data.
Is there a way to export only totals, or export it in a usable format, or does anyone have a ‘fix’ to allow the data to be used in Excel please?
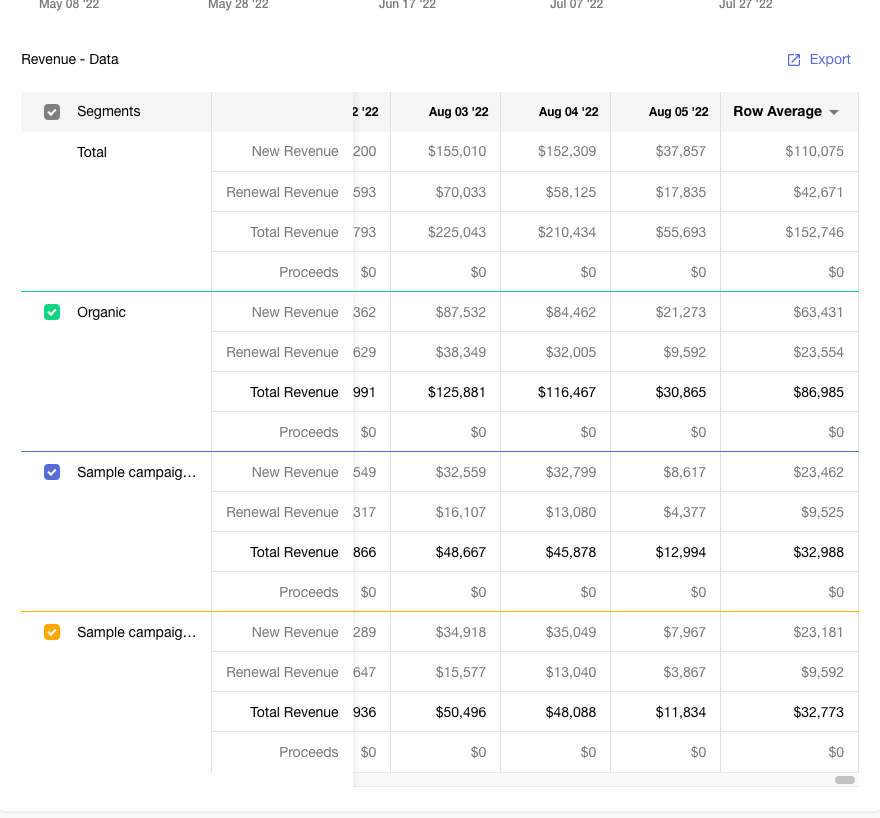
Ideally we’d have campaign/ad group name as column A, revenue total(s) as column B/C/D. This would allow us to easily aggregate the data, instead of having separate revenue columns for every single ad group or campaign.
Thanks in advance!
How do I make a revenue export useful?
 +1
+1

Hi
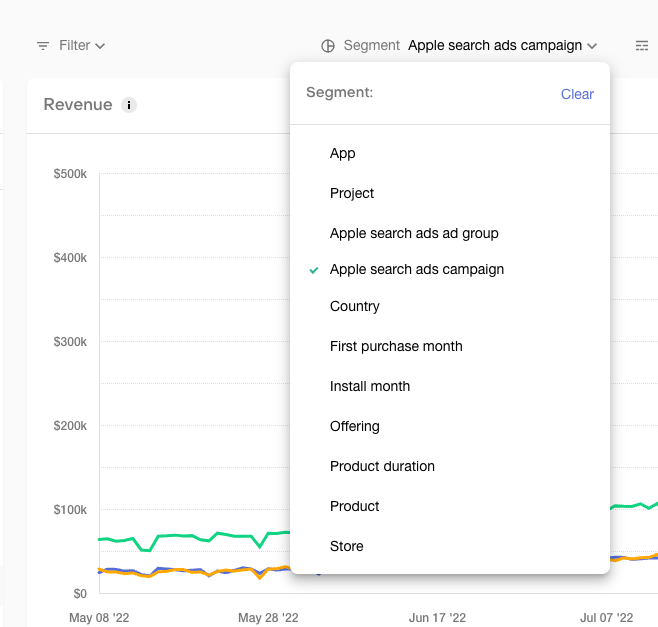
Have you tried segmenting first your charts by the ad campaigns then exporting it?
Reply

Enter your E-mail address. We'll send you an e-mail with instructions to reset your password.