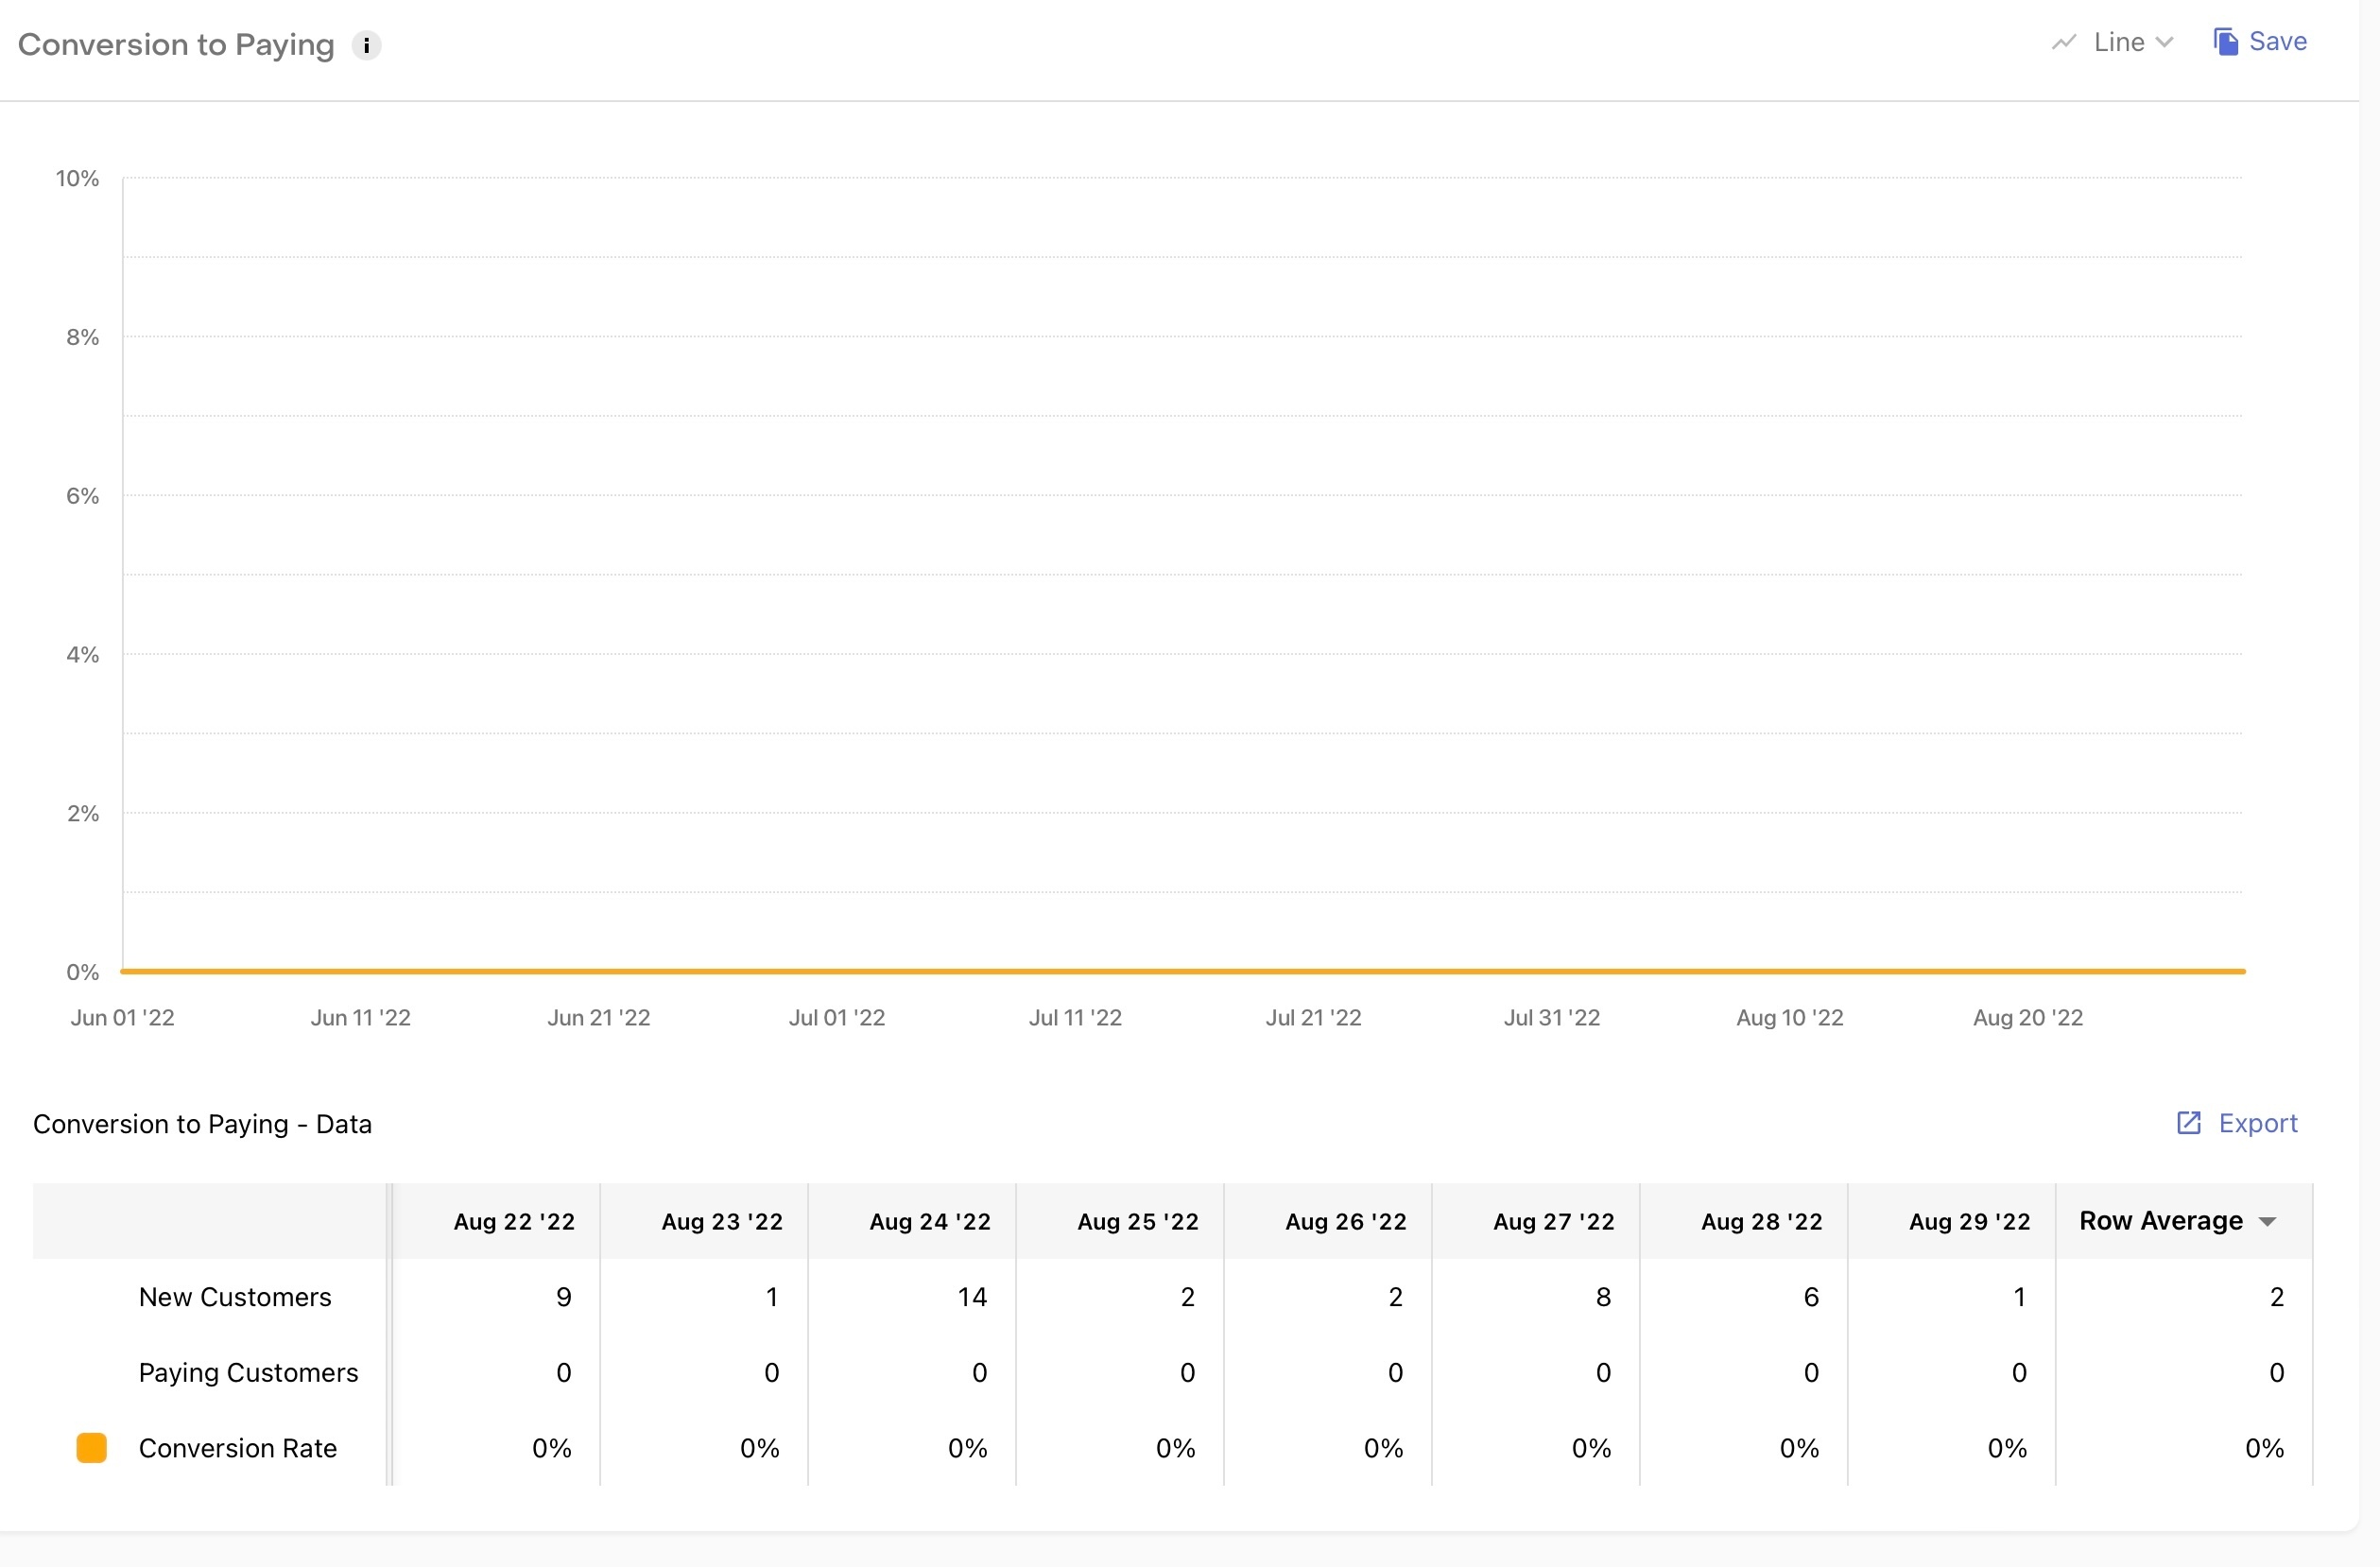
Why is the conversion to paying chart incorrect? Data lag/cohorts?
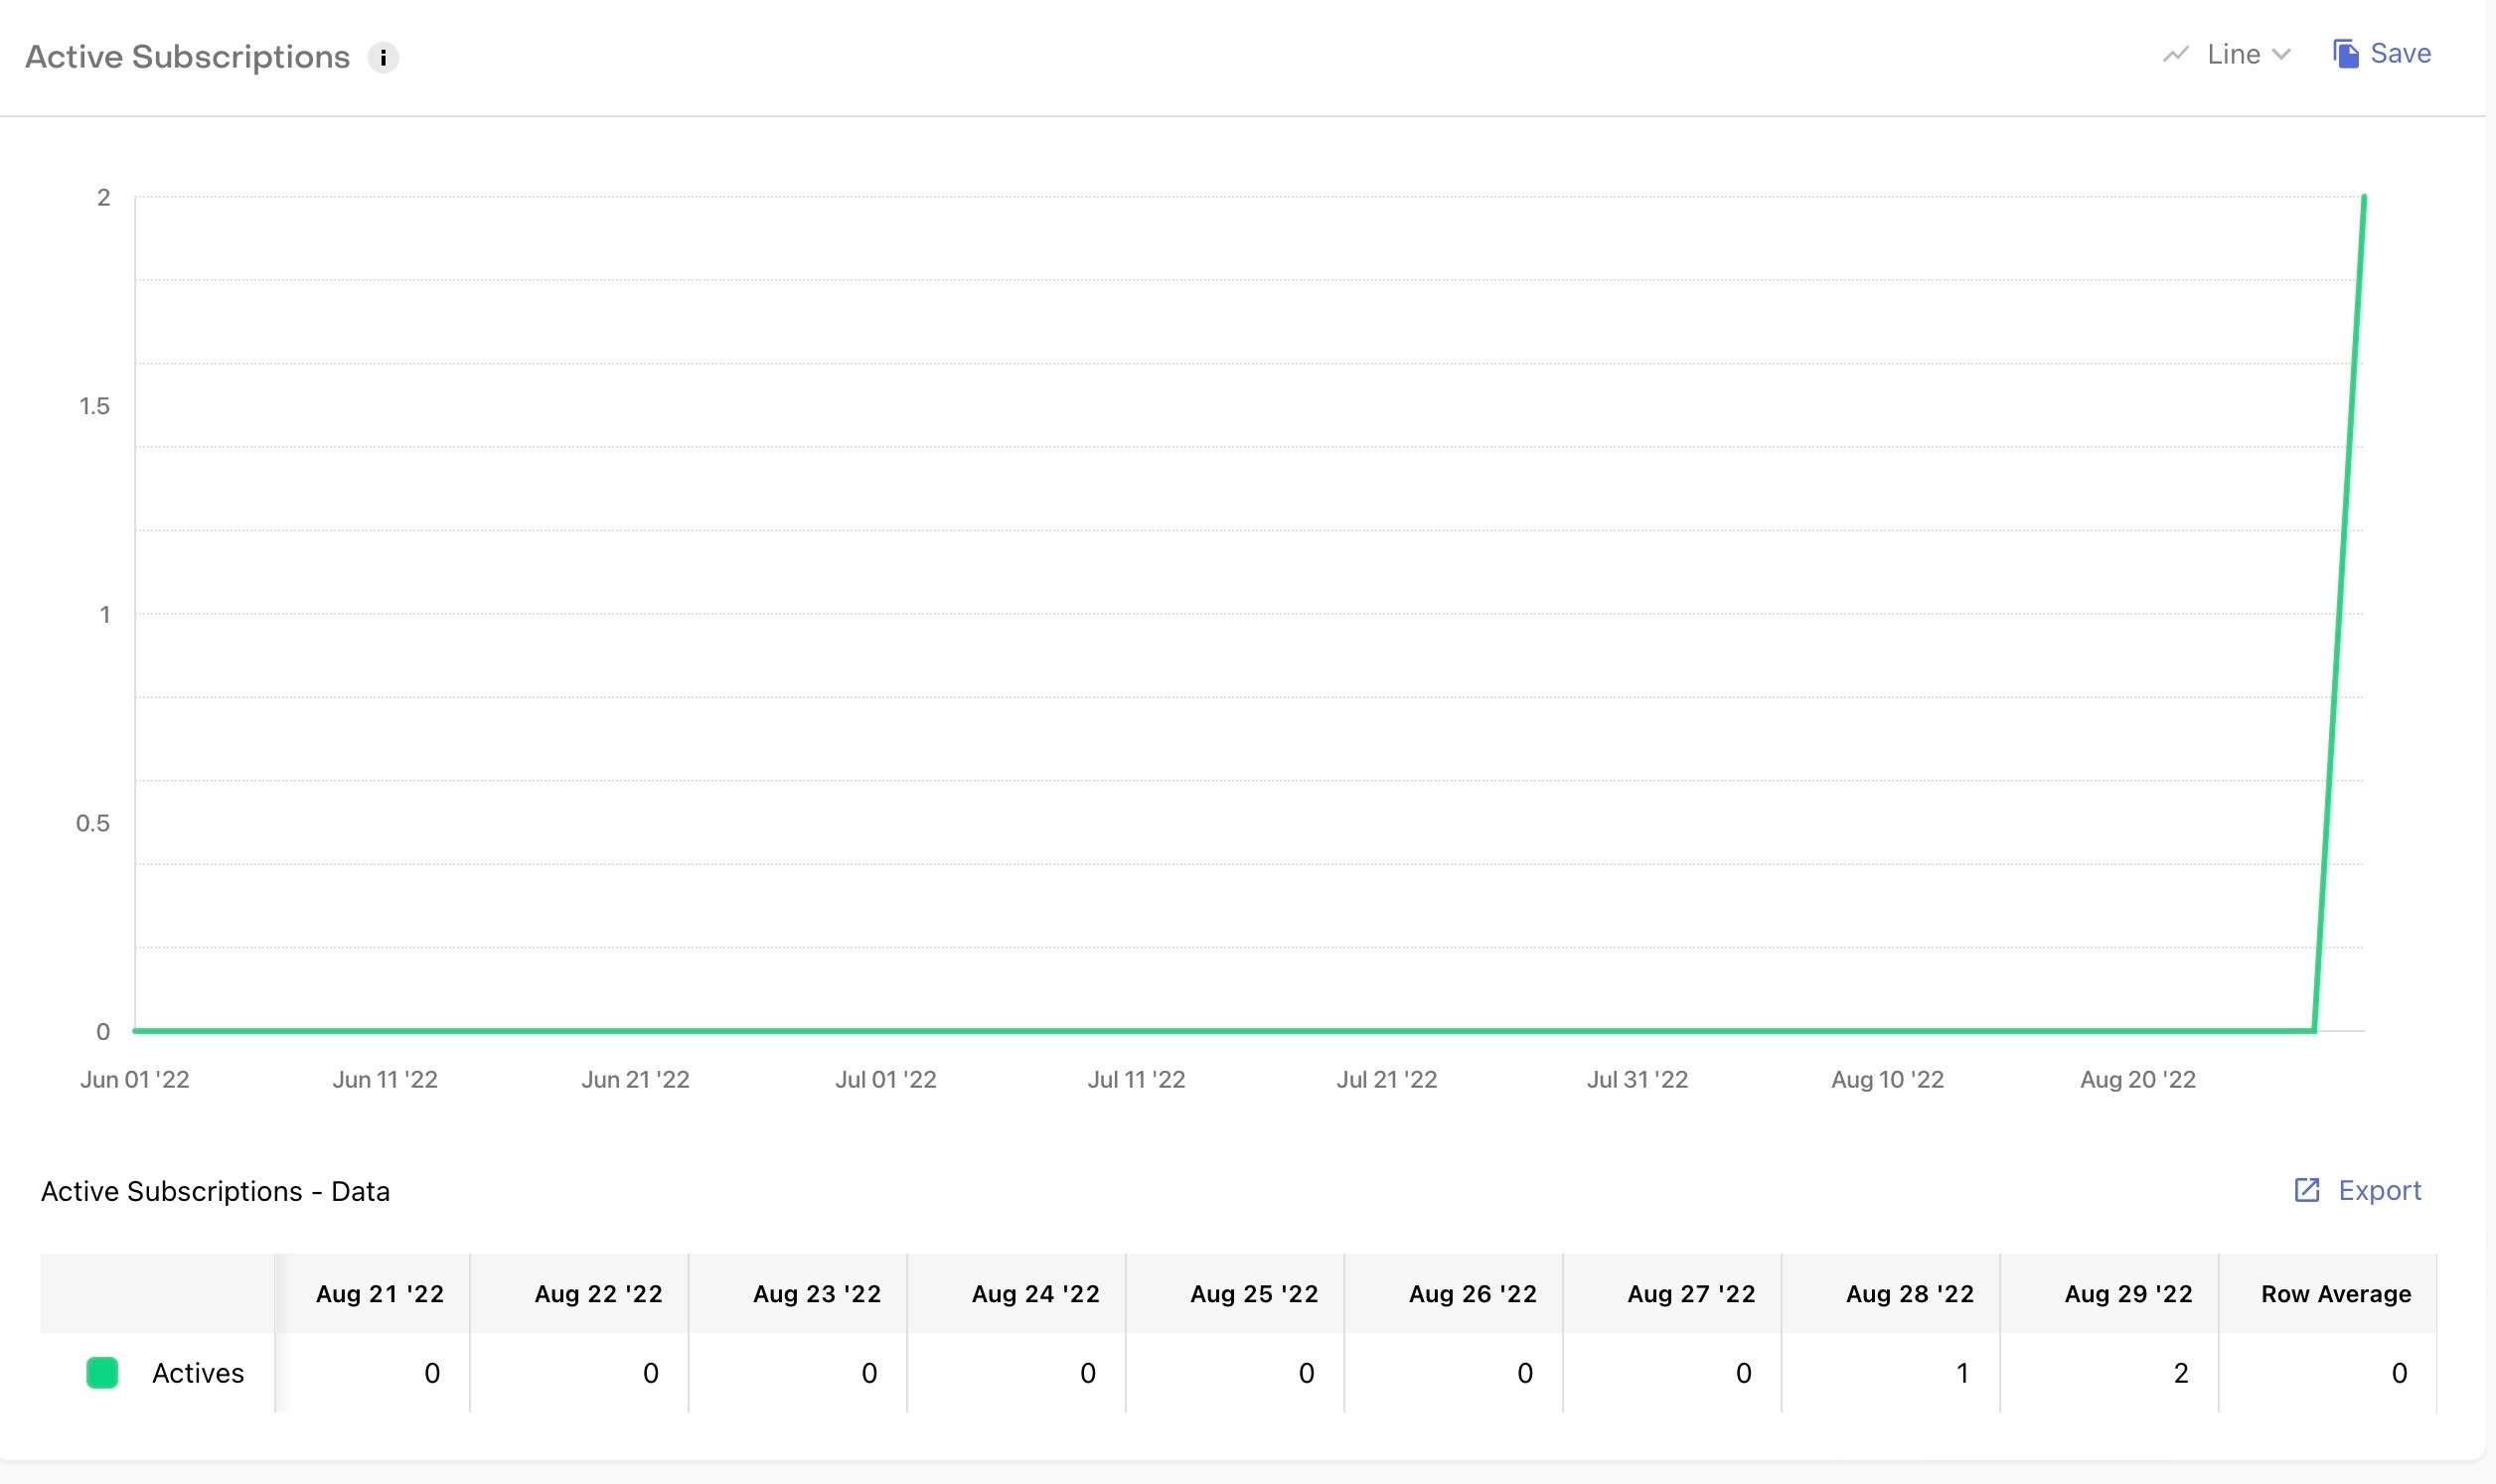
I’m testing my live purchases in the App Store before public announcement of the product. I’m probably misunderstanding but “Conversion to paying” chart shows zero conversion, even though I installed the app and paid for a real subscription myself yesterday. The subscription shows up correctly, but it shows zero conversions. Why?
Page 1 / 1
Oh, great news! I was too dismissive of that possibility in my first message. The pipelines that update these charts do operate independently of each other, so your transaction must have occurred in time for the Active Subscriptions refresh but missed the Conversion to Paying refresh.
In general, we expect these charts to be refreshed multiple times each day, and to typically be within a few hours of freshness with the other charts.
If you have any other questions about your charts let us know!
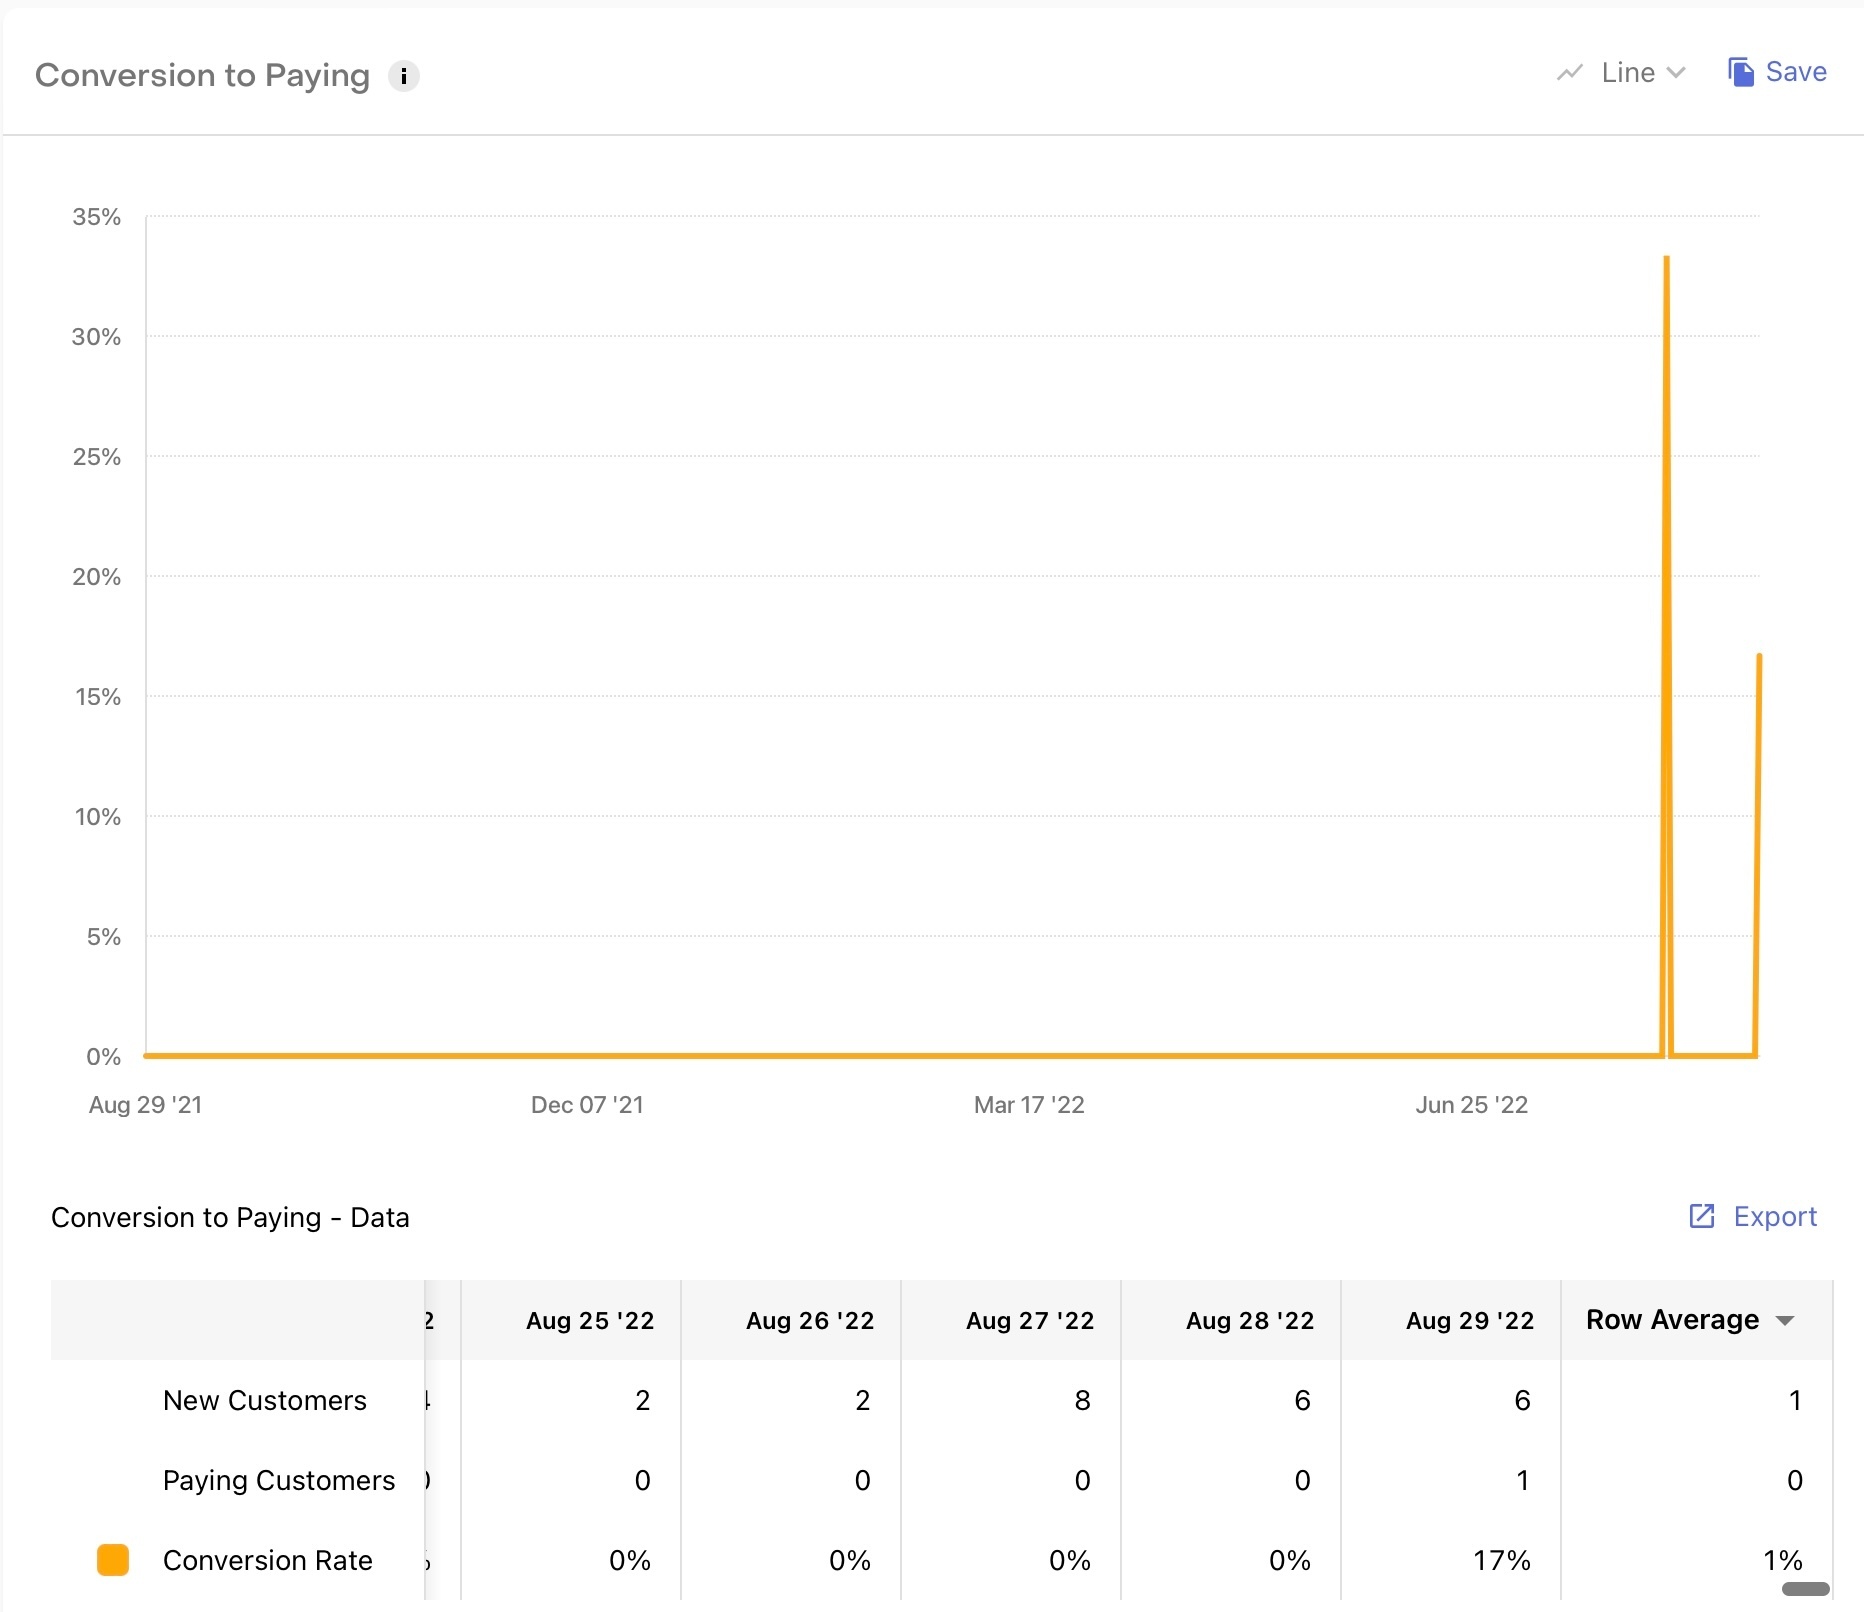
Dan thanks again. I went to go and do this and it looks like the chart is now up to date. It’s above my paygrade to know why this changed in just the last few hours. Is it a timezone thing? I’m in the UK
Thanks for checking! In that case, let’s take a closer look at your data and make sure everything’s behaving properly. Would you mind logging into the Dashboard and clicking on Account → Contact Us to submit a request directly to support? You can add a link to this post for context, and if you have multiple apps on your account please specify which one these charts are in reference to so we make sure we’re comparing against the right data.
Thanks!
Thanks Dan on all counts!
That’s a good suggestion - but showing YTD is zeroes all the way. I integrated and tested RC only within the last 3 months or so. I tried to redeem a sub promo code around 8th August and purchased for real (it didn’t consider me subbed) yesterday.
Weird eh.
Hi @Marc Palmer, thanks for reaching out! And good luck on the upcoming launch.
That difference that you’re looking at could be caused by data lag, but we’d only expect to ever see a few hours of lag between charts at most, and even that would be on the high-end.
The most likely cause for the discrepancy you’re seeing is that the two current Active Subscriptions being reported in the first screenshot are attributed to customer’s whose first seen date in your app was earlier than the range displayed in the Conversion to Paying screenshot.
Whether that was true of the install & purchase you made yesterday would depend a bit on how you’re setup to identify customers, and previous testing you’ve done with that device/user -- but a good way for us to first confirm that would be to extend the date range of the Conversion to Paying chart. If you look at “Year to date”, or extend it out even further than that if your implementation of RevenueCat happened earlier, you should see those conversions represented.